 Add to Chrome
 Add to Firefox
 Add to Edge
Visualization of Age Distributions as Elements of Medical Data-Stories
Sep 26, 2024


In various fields, including medicine, age distributions are crucial. Despite widespread media coverage of health topics, there remains a need to enhance health communication. Narrative medical visualization is promising for improving information comprehension and retention. This study explores the most effective ways to present age distributions of diseases through narrative visualizations. We conducted a thorough analysis of existing visualizations, held workshops with a broad audience, and reviewed relevant literature. From this, we identified design choices focusing on comprehension, aesthetics, engagement, and memorability. We specifically tested three pictogram variants: pictograms as bars, stacked pictograms, and annotations. After evaluating 18 visualizations with 72 participants and three expert reviews, we determined that annotations were most effective for comprehension and aesthetics. However, traditional bar charts were preferred for engagement, and other variants were more memorable. The study provides a set of design recommendations based on these insights.
Enhancing Uncertainty Communication in Time Series Predictions: Insights and Recommendations
Aug 22, 2024


As the world increasingly relies on mathematical models for forecasts in different areas, effective communication of uncertainty in time series predictions is important for informed decision making. This study explores how users estimate probabilistic uncertainty in time series predictions under different variants of line charts depicting uncertainty. It examines the role of individual characteristics and the influence of user-reported metrics on uncertainty estimations. By addressing these aspects, this paper aims to enhance the understanding of uncertainty visualization and for improving communication in time series forecast visualizations and the design of prediction data dashboards.As the world increasingly relies on mathematical models for forecasts in different areas, effective communication of uncertainty in time series predictions is important for informed decision making. This study explores how users estimate probabilistic uncertainty in time series predictions under different variants of line charts depicting uncertainty. It examines the role of individual characteristics and the influence of user-reported metrics on uncertainty estimations. By addressing these aspects, this paper aims to enhance the understanding of uncertainty visualization and for improving communication in time series forecast visualizations and the design of prediction data dashboards.
Surgical Phase and Instrument Recognition: How to identify appropriate Dataset Splits
Jun 29, 2023Purpose: The development of machine learning models for surgical workflow and instrument recognition from temporal data represents a challenging task due to the complex nature of surgical workflows. In particular, the imbalanced distribution of data is one of the major challenges in the domain of surgical workflow recognition. In order to obtain meaningful results, careful partitioning of data into training, validation, and test sets, as well as the selection of suitable evaluation metrics are crucial. Methods: In this work, we present an openly available web-based application that enables interactive exploration of dataset partitions. The proposed visual framework facilitates the assessment of dataset splits for surgical workflow recognition, especially with regard to identifying sub-optimal dataset splits. Currently, it supports visualization of surgical phase and instrument annotations. Results: In order to validate the dedicated interactive visualizations, we use a dataset split of the Cholec80 dataset. This dataset split was specifically selected to reflect a case of strong data imbalance. Using our software, we were able to identify phases, phase transitions, and combinations of surgical instruments that were not represented in one of the sets. Conclusion: In order to obtain meaningful results in highly unbalanced class distributions, special care should be taken with respect to the selection of an appropriate split. Interactive data visualization represents a promising approach for the assessment of machine learning datasets. The source code is available at https://github.com/Cardio-AI/endovis-ml
Cardiac Cohort Classification based on Morphologic and Hemodynamic Parameters extracted from 4D PC-MRI Data
Oct 12, 2020
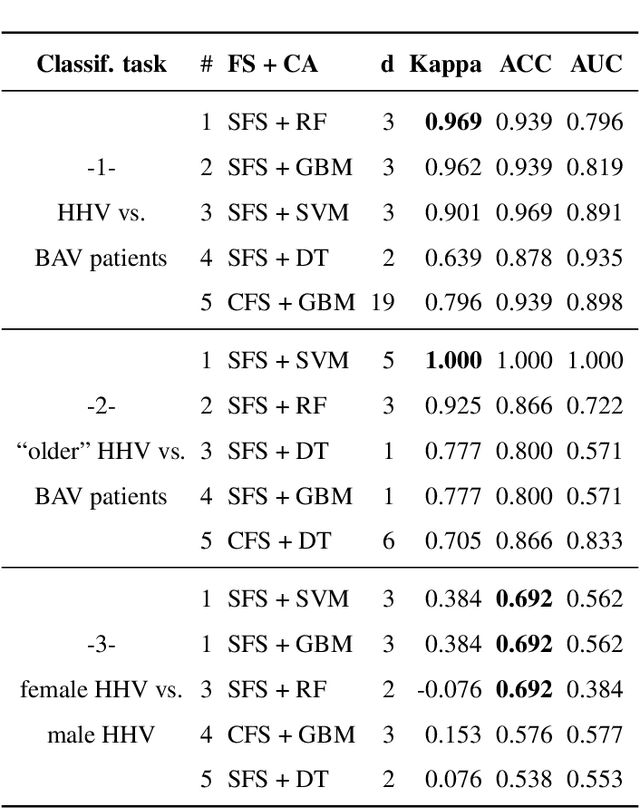
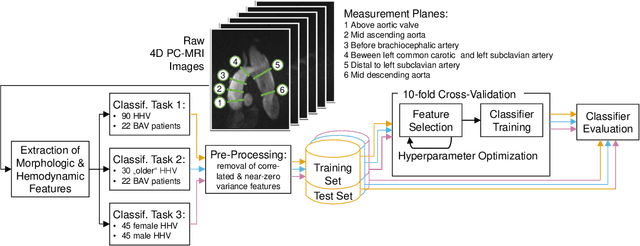
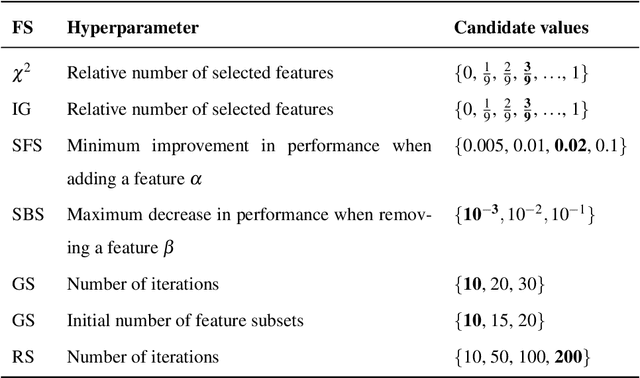
An accurate assessment of the cardiovascular system and prediction of cardiovascular diseases (CVDs) are crucial. Measured cardiac blood flow data provide insights about patient-specific hemodynamics, where many specialized techniques have been developed for the visual exploration of such data sets to better understand the influence of morphological and hemodynamic conditions on CVDs. However, there is a lack of machine learning approaches techniques that allow a feature-based classification of heart-healthy people and patients with CVDs.In this work, we investigate the potential of morphological and hemodynamic characteristics, extracted from measured blood flow data in the aorta, for the classification of heart-healthy volunteers and patients with bicuspid aortic valve (BAV). Furthermore, we research if there are characteristic features to classify male and female as well as younger and older heart-healthy volunteers. We propose a data analysis pipeline for the classification of the cardiac status, encompassing feature selection, model training and hyperparameter tuning. In our experiments, we use several feature selection methods and classification algorithms to train separate models for the healthy subgroups and BAV patients. We report on classification performance and investigate the predictive power of morphological and hemodynamic features with regard to the classification oft he defined groups. Finally, we identify the key features for the best models.
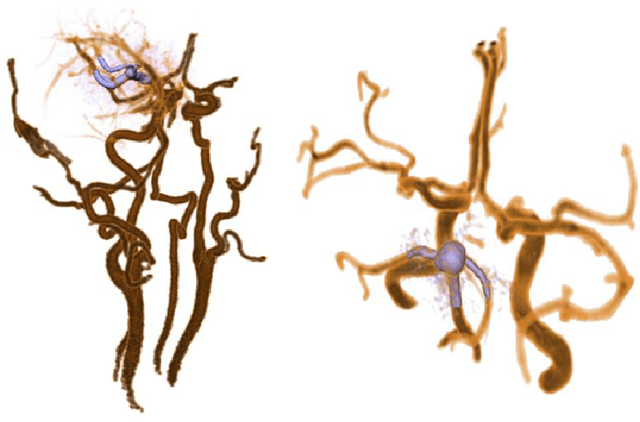
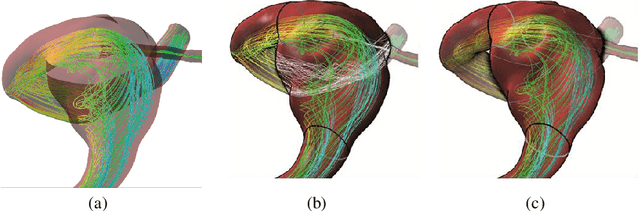
MedMeshCNN -- Enabling MeshCNN for Medical Surface Models
Sep 10, 2020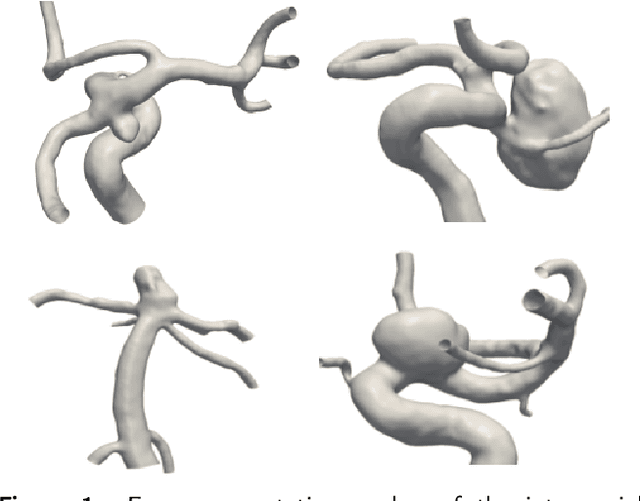
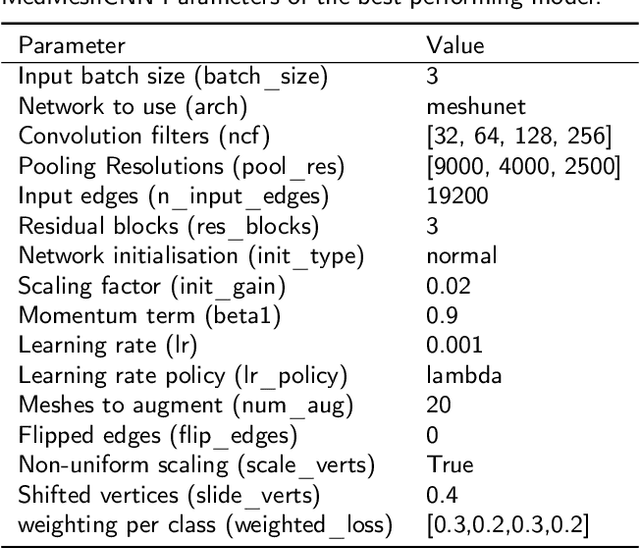
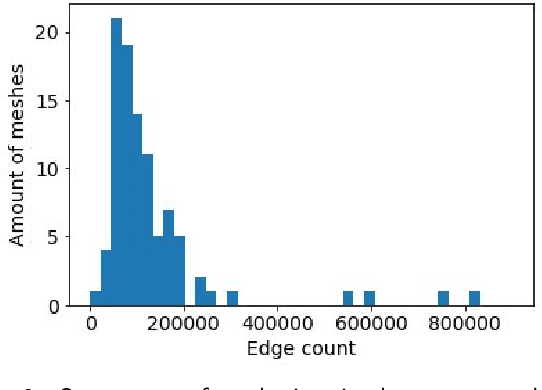
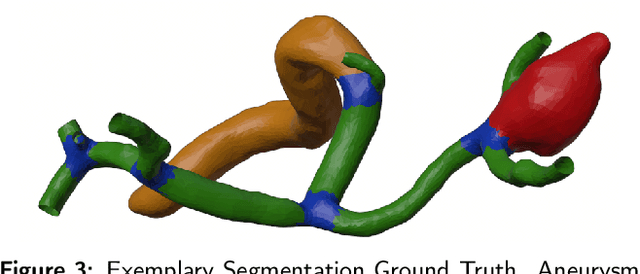
Background and objective: MeshCNN is a recently proposed Deep Learning framework that drew attention due to its direct operation on irregular, non-uniform 3D meshes. On selected benchmarking datasets, it outperformed state-of-the-art methods within classification and segmentation tasks. Especially, the medical domain provides a large amount of complex 3D surface models that may benefit from processing with MeshCNN. However, several limitations prevent outstanding performances of MeshCNN on highly diverse medical surface models. Within this work, we propose MedMeshCNN as an expansion for complex, diverse, and fine-grained medical data. Methods: MedMeshCNN follows the functionality of MeshCNN with a significantly increased memory efficiency that allows retaining patient-specific properties during the segmentation process. Furthermore, it enables the segmentation of pathological structures that often come with highly imbalanced class distributions. Results: We tested the performance of MedMeshCNN on a complex part segmentation task of intracranial aneurysms and their surrounding vessel structures and reached a mean Intersection over Union of 63.24\%. The pathological aneurysm is segmented with an Intersection over Union of 71.4\%. Conclusions: These results demonstrate that MedMeshCNN enables the application of MeshCNN on complex, fine-grained medical surface meshes. The imbalanced class distribution deriving from the pathological finding is considered by MedMeshCNN and patient-specific properties are mostly retained during the segmentation process.
Visual Analytics of Image-Centric Cohort Studies in Epidemiology
Jan 15, 2015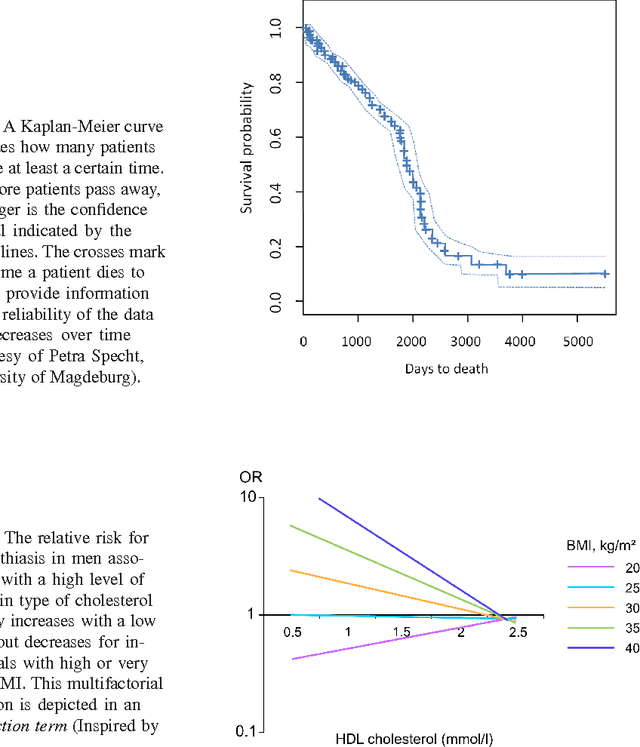
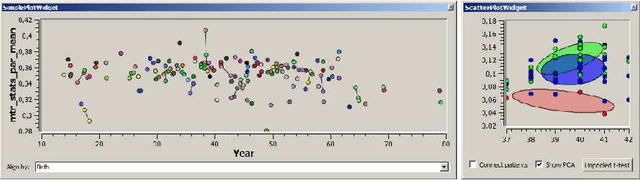


Epidemiology characterizes the influence of causes to disease and health conditions of defined populations. Cohort studies are population-based studies involving usually large numbers of randomly selected individuals and comprising numerous attributes, ranging from self-reported interview data to results from various medical examinations, e.g., blood and urine samples. Since recently, medical imaging has been used as an additional instrument to assess risk factors and potential prognostic information. In this chapter, we discuss such studies and how the evaluation may benefit from visual analytics. Cluster analysis to define groups, reliable image analysis of organs in medical imaging data and shape space exploration to characterize anatomical shapes are among the visual analytics tools that may enable epidemiologists to fully exploit the potential of their huge and complex data. To gain acceptance, visual analytics tools need to complement more classical epidemiologic tools, primarily hypothesis-driven statistical analysis.
Visual Exploration of Simulated and Measured Blood Flow
Sep 05, 2012
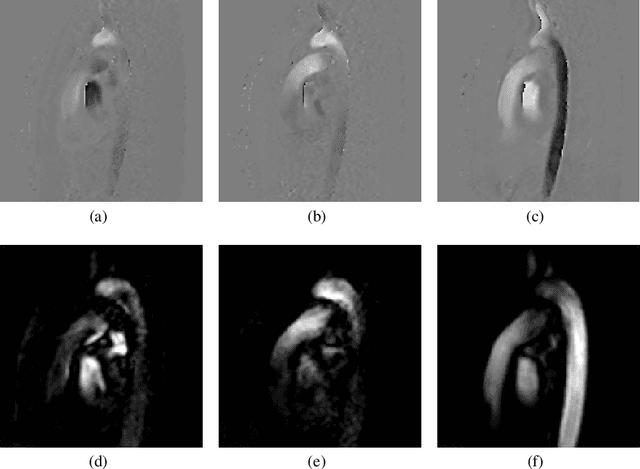
Morphology of cardiovascular tissue is influenced by the unsteady behavior of the blood flow and vice versa. Therefore, the pathogenesis of several cardiovascular diseases is directly affected by the blood-flow dynamics. Understanding flow behavior is of vital importance to understand the cardiovascular system and potentially harbors a considerable value for both diagnosis and risk assessment. The analysis of hemodynamic characteristics involves qualitative and quantitative inspection of the blood-flow field. Visualization plays an important role in the qualitative exploration, as well as the definition of relevant quantitative measures and its validation. There are two main approaches to obtain information about the blood flow: simulation by computational fluid dynamics, and in-vivo measurements. Although research on blood flow simulation has been performed for decades, many open problems remain concerning accuracy and patient-specific solutions. Possibilities for real measurement of blood flow have recently increased considerably by new developments in magnetic resonance imaging which enable the acquisition of 3D quantitative measurements of blood-flow velocity fields. This chapter presents the visualization challenges for both simulation and real measurements of unsteady blood-flow fields.