 Add to Chrome
 Add to Firefox
 Add to Edge
Length of Stay prediction for Hospital Management using Domain Adaptation
Jun 29, 2023


Inpatient length of stay (LoS) is an important managerial metric which if known in advance can be used to efficiently plan admissions, allocate resources and improve care. Using historical patient data and machine learning techniques, LoS prediction models can be developed. Ethically, these models can not be used for patient discharge in lieu of unit heads but are of utmost necessity for hospital management systems in charge of effective hospital planning. Therefore, the design of the prediction system should be adapted to work in a true hospital setting. In this study, we predict early hospital LoS at the granular level of admission units by applying domain adaptation to leverage information learned from a potential source domain. Time-varying data from 110,079 and 60,492 patient stays to 8 and 9 intensive care units were respectively extracted from eICU-CRD and MIMIC-IV. These were fed into a Long-Short Term Memory and a Fully connected network to train a source domain model, the weights of which were transferred either partially or fully to initiate training in target domains. Shapley Additive exPlanations (SHAP) algorithms were used to study the effect of weight transfer on model explanability. Compared to the benchmark, the proposed weight transfer model showed statistically significant gains in prediction accuracy (between 1% and 5%) as well as computation time (up to 2hrs) for some target domains. The proposed method thus provides an adapted clinical decision support system for hospital management that can ease processes of data access via ethical committee, computation infrastructures and time.
Duality in Multi-View Restricted Kernel Machines
May 26, 2023


We propose a unifying setting that combines existing restricted kernel machine methods into a single primal-dual multi-view framework for kernel principal component analysis in both supervised and unsupervised settings. We derive the primal and dual representations of the framework and relate different training and inference algorithms from a theoretical perspective. We show how to achieve full equivalence in primal and dual formulations by rescaling primal variables. Finally, we experimentally validate the equivalence and provide insight into the relationships between different methods on a number of time series data sets by recursively forecasting unseen test data and visualizing the learned features.
Client Recruitment for Federated Learning in ICU Length of Stay Prediction
Apr 28, 2023


Machine and deep learning methods for medical and healthcare applications have shown significant progress and performance improvement in recent years. These methods require vast amounts of training data which are available in the medical sector, albeit decentralized. Medical institutions generate vast amounts of data for which sharing and centralizing remains a challenge as the result of data and privacy regulations. The federated learning technique is well-suited to tackle these challenges. However, federated learning comes with a new set of open problems related to communication overhead, efficient parameter aggregation, client selection strategies and more. In this work, we address the step prior to the initiation of a federated network for model training, client recruitment. By intelligently recruiting clients, communication overhead and overall cost of training can be reduced without sacrificing predictive performance. Client recruitment aims at pre-excluding potential clients from partaking in the federation based on a set of criteria indicative of their eventual contributions to the federation. In this work, we propose a client recruitment approach using only the output distribution and sample size at the client site. We show how a subset of clients can be recruited without sacrificing model performance whilst, at the same time, significantly improving computation time. By applying the recruitment approach to the training of federated models for accurate patient Length of Stay prediction using data from 189 Intensive Care Units, we show how the models trained in federations made up from recruited clients significantly outperform federated models trained with the standard procedure in terms of predictive power and training time.
Multi-view Kernel PCA for Time series Forecasting
Jan 24, 2023In this paper, we propose a kernel principal component analysis model for multi-variate time series forecasting, where the training and prediction schemes are derived from the multi-view formulation of Restricted Kernel Machines. The training problem is simply an eigenvalue decomposition of the summation of two kernel matrices corresponding to the views of the input and output data. When a linear kernel is used for the output view, it is shown that the forecasting equation takes the form of kernel ridge regression. When that kernel is non-linear, a pre-image problem has to be solved to forecast a point in the input space. We evaluate the model on several standard time series datasets, perform ablation studies, benchmark with closely related models and discuss its results.
Leverage Score Sampling for Complete Mode Coverage in Generative Adversarial Networks
Apr 27, 2021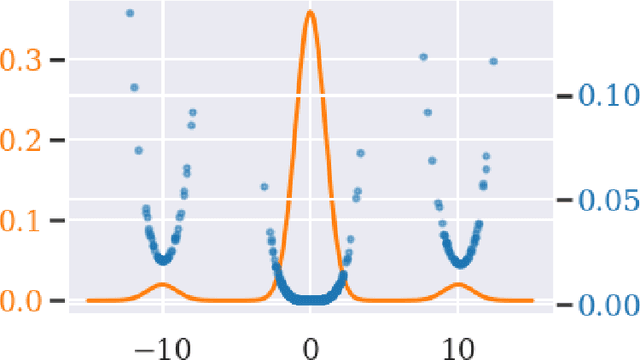
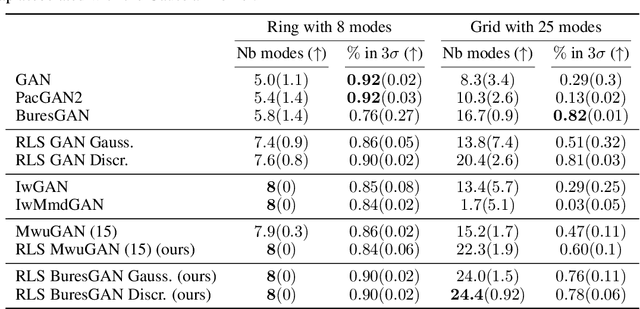

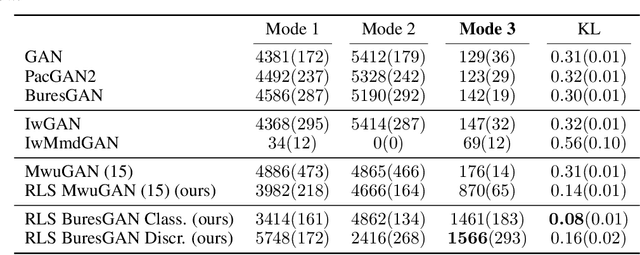
Commonly, machine learning models minimize an empirical expectation. As a result, the trained models typically perform well for the majority of the data but the performance may deteriorate on less dense regions of the dataset. This issue also arises in generative modeling. A generative model may overlook underrepresented modes that are less frequent in the empirical data distribution. This problem is known as complete mode coverage. We propose a sampling procedure based on ridge leverage scores which significantly improves mode coverage when compared to standard methods and can easily be combined with any GAN. Ridge Leverage Scores (RLSs) are computed by using an explicit feature map, associated with the next-to-last layer of a GAN discriminator or of a pre-trained network, or by using an implicit feature map corresponding to a Gaussian kernel. Multiple evaluations against recent approaches of complete mode coverage show a clear improvement when using the proposed sampling strategy.
The Bures Metric for Taming Mode Collapse in Generative Adversarial Networks
Jun 16, 2020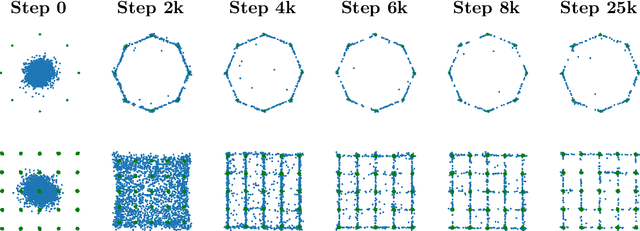
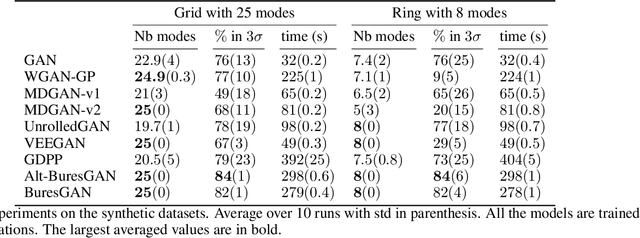
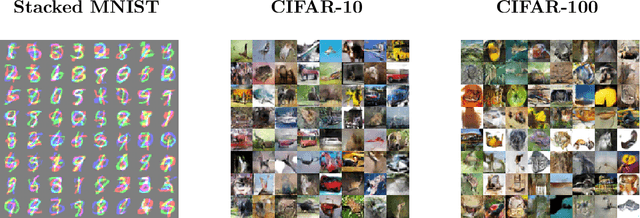
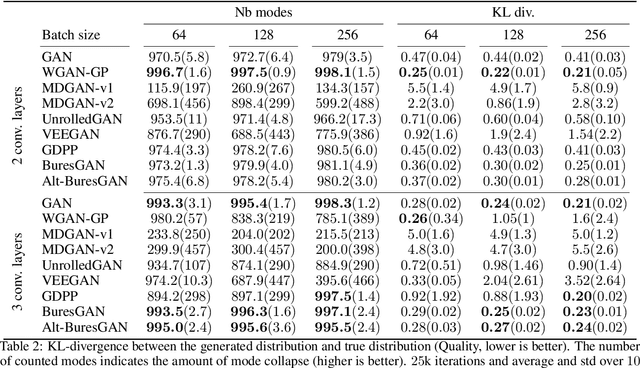
Generative Adversarial Networks (GANs) are performant generative methods yielding high-quality samples. However, under certain circumstances, the training of GANs can lead to mode collapse or mode dropping, i.e. the generative models not being able to sample from the entire probability distribution. To address this problem, we use the last layer of the discriminator as a feature map to study the distribution of the real and the fake data. During training, we propose to match the real batch diversity to the fake batch diversity by using the Bures distance between covariance matrices in feature space. The computation of the Bures distance can be conveniently done in either feature space or kernel space in terms of the covariance and kernel matrix respectively. We observe that diversity matching reduces mode collapse substantially and has a positive effect on the sample quality. On the practical side, a very simple training procedure, that does not require additional hyperparameter tuning, is proposed and assessed on several datasets.
Applicability and interpretation of the deterministic weighted cepstral distance
Mar 08, 2018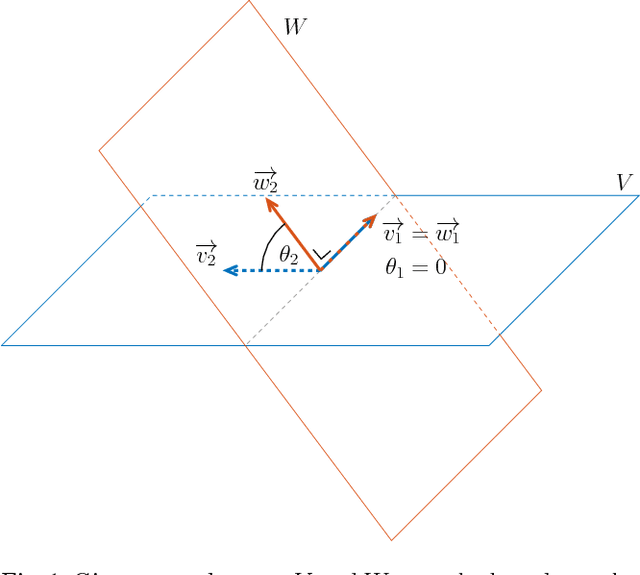
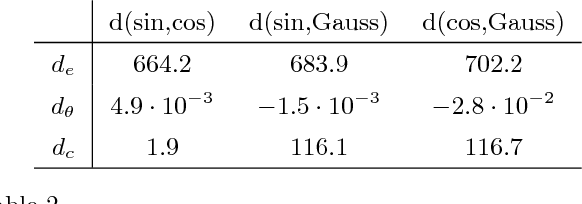
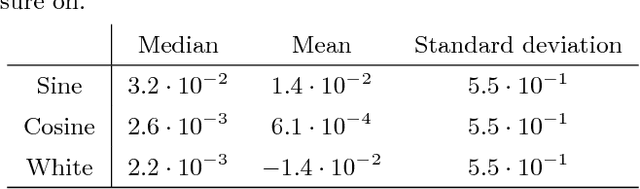
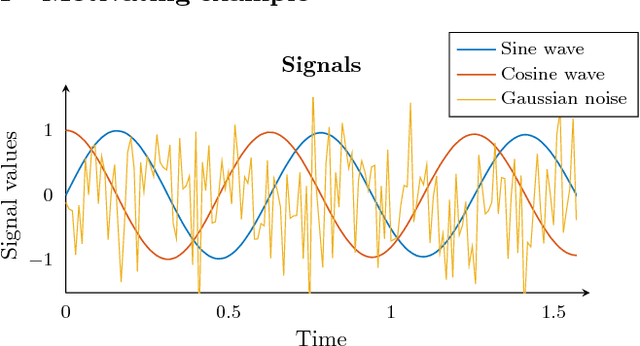
Quantifying similarity between data objects is an important part of modern data science. Deciding what similarity measure to use is very application dependent. In this paper, we combine insights from systems theory and machine learning, and investigate the weighted cepstral distance, which was previously defined for signals coming from ARMA models. We provide an extension of this distance to invertible deterministic linear time invariant single input single output models, and assess its applicability. We show that it can always be interpreted in terms of the poles and zeros of the underlying model, and that, in the case of stable, minimum-phase, or unstable, maximum-phase models, a geometrical interpretation in terms of subspace angles can be given. We then devise a method to assess stability and phase-type of the generating models, using only input/output signal information. In this way, we prove a connection between the extended weighted cepstral distance and a weighted cepstral model norm. In this way, we provide a purely data-driven way to assess different underlying dynamics of input/output signal pairs, without the need for any system identification step. This can be useful in machine learning tasks such as time series clustering. An iPython tutorial is published complementary to this paper, containing implementations of the various methods and algorithms presented here, as well as some numerical illustrations of the equivalences proven here.
A time series distance measure for efficient clustering of input output signals by their underlying dynamics
Mar 06, 2017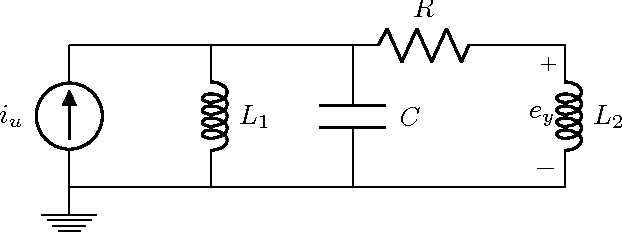
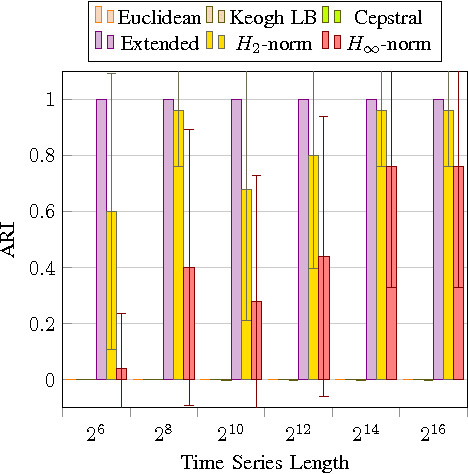
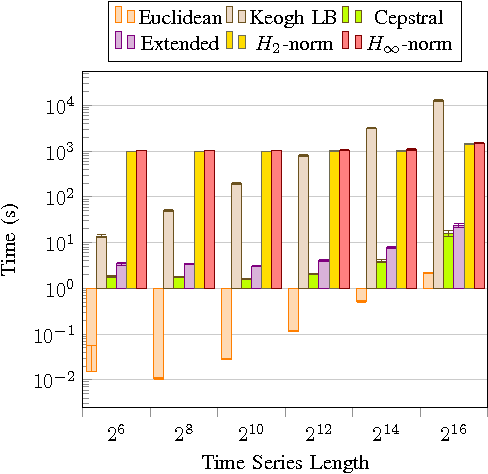
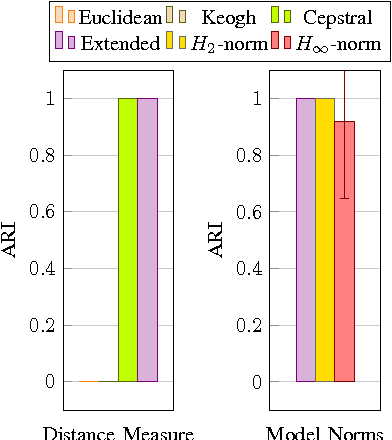
Starting from a dataset with input/output time series generated by multiple deterministic linear dynamical systems, this paper tackles the problem of automatically clustering these time series. We propose an extension to the so-called Martin cepstral distance, that allows to efficiently cluster these time series, and apply it to simulated electrical circuits data. Traditionally, two ways of handling the problem are used. The first class of methods employs a distance measure on time series (e.g. Euclidean, Dynamic Time Warping) and a clustering technique (e.g. k-means, k-medoids, hierarchical clustering) to find natural groups in the dataset. It is, however, often not clear whether these distance measures effectively take into account the specific temporal correlations in these time series. The second class of methods uses the input/output data to identify a dynamic system using an identification scheme, and then applies a model norm-based distance (e.g. H2, H-infinity) to find out which systems are similar. This, however, can be very time consuming for large amounts of long time series data. We show that the new distance measure presented in this paper performs as good as when every input/output pair is modelled explicitly, but remains computationally much less complex. The complexity of calculating this distance between two time series of length N is O(N logN).
Assessing binary classifiers using only positive and unlabeled data
Dec 30, 2015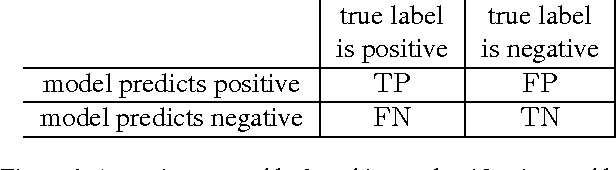
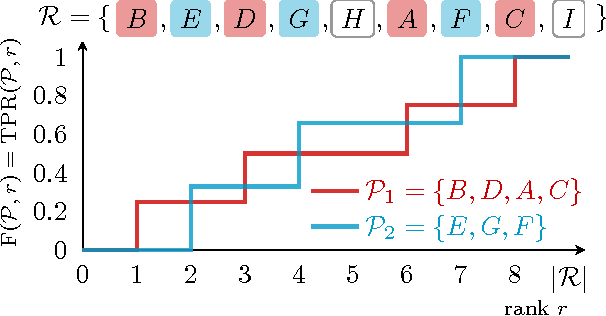
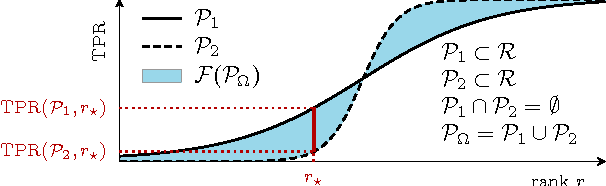
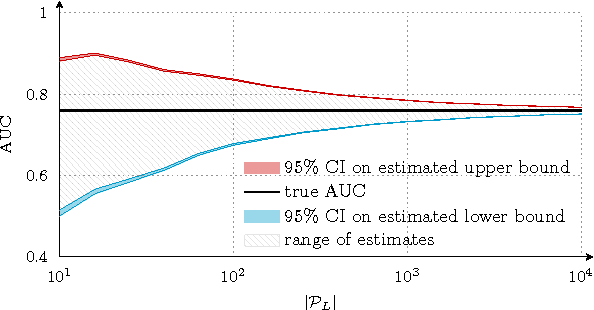
Assessing the performance of a learned model is a crucial part of machine learning. However, in some domains only positive and unlabeled examples are available, which prohibits the use of most standard evaluation metrics. We propose an approach to estimate any metric based on contingency tables, including ROC and PR curves, using only positive and unlabeled data. Estimating these performance metrics is essentially reduced to estimating the fraction of (latent) positives in the unlabeled set, assuming known positives are a random sample of all positives. We provide theoretical bounds on the quality of our estimates, illustrate the importance of estimating the fraction of positives in the unlabeled set and demonstrate empirically that we are able to reliably estimate ROC and PR curves on real data.
Building Classifiers to Predict the Start of Glucose-Lowering Pharmacotherapy Using Belgian Health Expenditure Data
Apr 28, 2015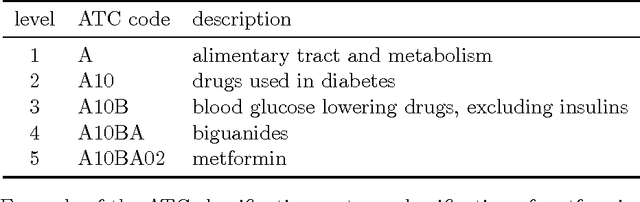
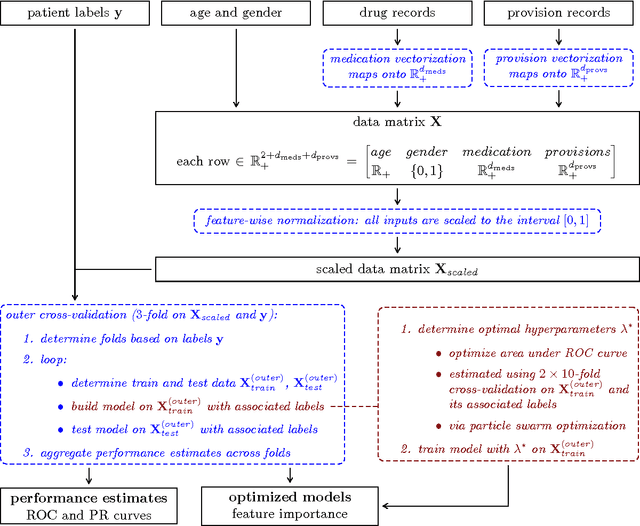
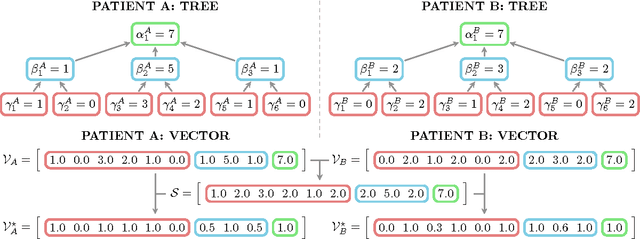
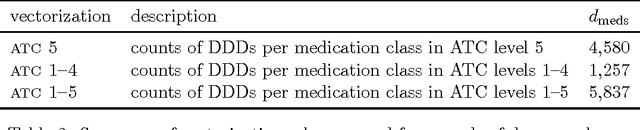
Early diagnosis is important for type 2 diabetes (T2D) to improve patient prognosis, prevent complications and reduce long-term treatment costs. We present a novel risk profiling approach based exclusively on health expenditure data that is available to Belgian mutual health insurers. We used expenditure data related to drug purchases and medical provisions to construct models that predict whether a patient will start glucose-lowering pharmacotherapy in the coming years, based on that patient's recent medical expenditure history. The design and implementation of the modeling strategy are discussed in detail and several learning methods are benchmarked for our application. Our best performing model obtains between 74.9% and 76.8% area under the ROC curve, which is comparable to state-of-the-art risk prediction approaches for T2D based on questionnaires. In contrast to other methods, our approach can be implemented on a population-wide scale at virtually no extra operational cost. Possibly, our approach can be further improved by additional information about some risk factors of T2D that is unavailable in health expenditure data.