 Add to Chrome
 Add to Firefox
 Add to Edge
Statistical Inference for Score Decompositions
Mar 04, 2026We introduce inference methods for score decompositions, which partition scoring functions for predictive assessment into three interpretable components: miscalibration, discrimination, and uncertainty. Our estimation and inference relies on a linear recalibration of the forecasts, which is applicable to general multi-step ahead point forecasts such as means and quantiles due to its validity for both smooth and non-smooth scoring functions. This approach ensures desirable finite-sample properties, enables asymptotic inference, and establishes a direct connection to the classical Mincer-Zarnowitz regression. The resulting inference framework facilitates tests for equal forecast calibration or discrimination, which yield three key advantages. They enhance the information content of predictive ability tests by decomposing scores, deliver higher statistical power in certain scenarios, and formally connect scoring-function-based evaluation to traditional calibration tests, such as financial backtests. Applications demonstrate the method's utility. We find that for survey inflation forecasts, discrimination abilities can differ significantly even when overall predictive ability does not. In an application to financial risk models, our tests provide deeper insights into the calibration and information content of volatility and Value-at-Risk forecasts. By disentangling forecast accuracy from backtest performance, the method exposes critical shortcomings in current banking regulation.
Evaluating Probabilistic Classifiers: The Triptych
Jan 25, 2023Probability forecasts for binary outcomes, often referred to as probabilistic classifiers or confidence scores, are ubiquitous in science and society, and methods for evaluating and comparing them are in great demand. We propose and study a triptych of diagnostic graphics that focus on distinct and complementary aspects of forecast performance: The reliability diagram addresses calibration, the receiver operating characteristic (ROC) curve diagnoses discrimination ability, and the Murphy diagram visualizes overall predictive performance and value. A Murphy curve shows a forecast's mean elementary scores, including the widely used misclassification rate, and the area under a Murphy curve equals the mean Brier score. For a calibrated forecast, the reliability curve lies on the diagonal, and for competing calibrated forecasts, the ROC and Murphy curves share the same number of crossing points. We invoke the recently developed CORP (Consistent, Optimally binned, Reproducible, and Pool-Adjacent-Violators (PAV) algorithm based) approach to craft reliability diagrams and decompose a mean score into miscalibration (MCB), discrimination (DSC), and uncertainty (UNC) components. Plots of the DSC measure of discrimination ability versus the calibration metric MCB visualize classifier performance across multiple competitors. The proposed tools are illustrated in empirical examples from astrophysics, economics, and social science.
Evaluating probabilistic classifiers: Reliability diagrams and score decompositions revisited
Aug 07, 2020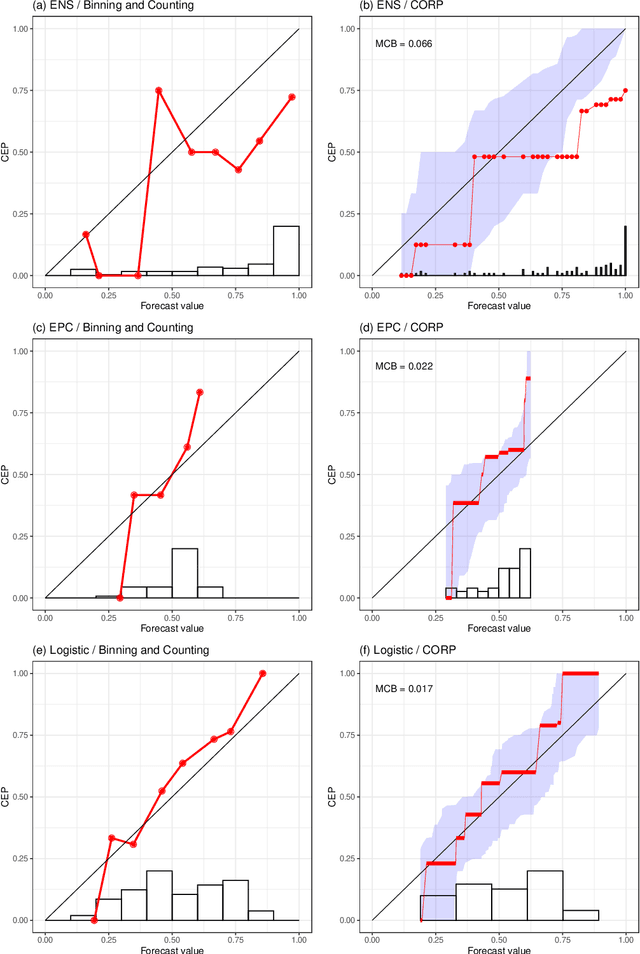

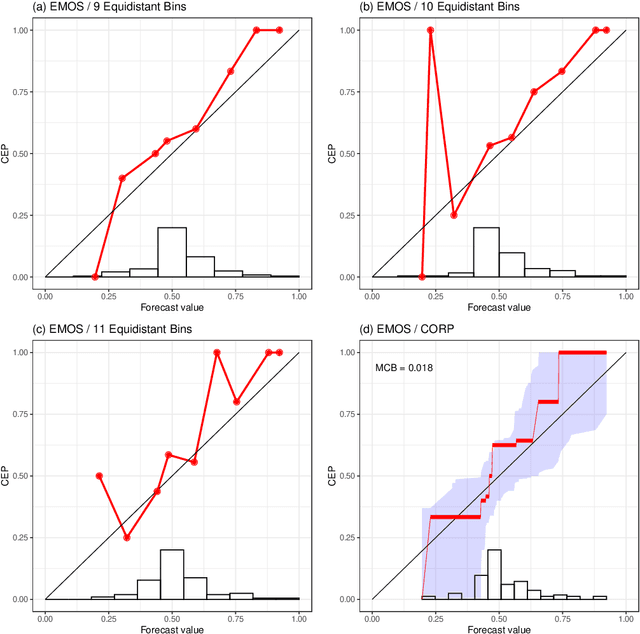

A probability forecast or probabilistic classifier is reliable or calibrated if the predicted probabilities are matched by ex post observed frequencies, as examined visually in reliability diagrams. The classical binning and counting approach to plotting reliability diagrams has been hampered by a lack of stability under unavoidable, ad hoc implementation decisions. Here we introduce the CORP approach, which generates provably statistically Consistent, Optimally binned, and Reproducible reliability diagrams in an automated way. CORP is based on non-parametric isotonic regression and implemented via the Pool-adjacent-violators (PAV) algorithm - essentially, the CORP reliability diagram shows the graph of the PAV- (re)calibrated forecast probabilities. The CORP approach allows for uncertainty quantification via either resampling techniques or asymptotic theory, furnishes a new numerical measure of miscalibration, and provides a CORP based Brier score decomposition that generalizes to any proper scoring rule. We anticipate that judicious uses of the PAV algorithm yield improved tools for diagnostics and inference for a very wide range of statistical and machine learning methods.