 Add to Chrome
 Add to Firefox
 Add to Edge
A Review, Framework and R toolkit for Exploring, Evaluating, and Comparing Visualizations
Feb 22, 2019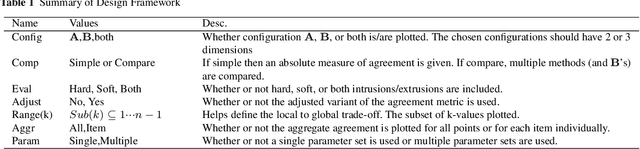
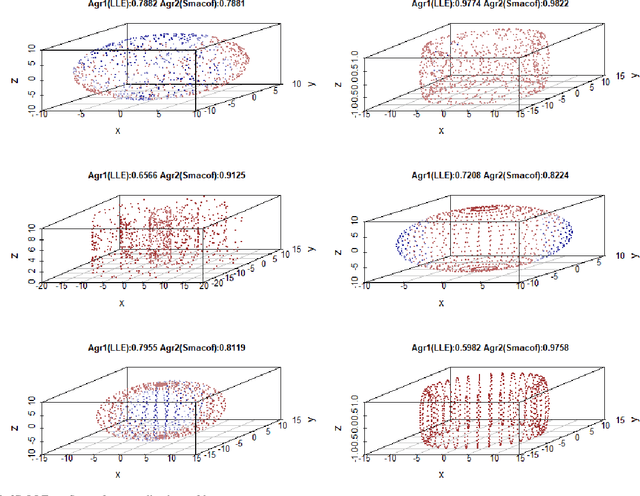
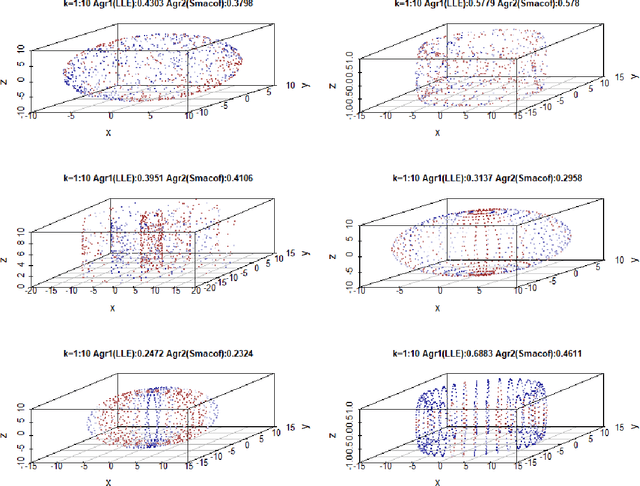
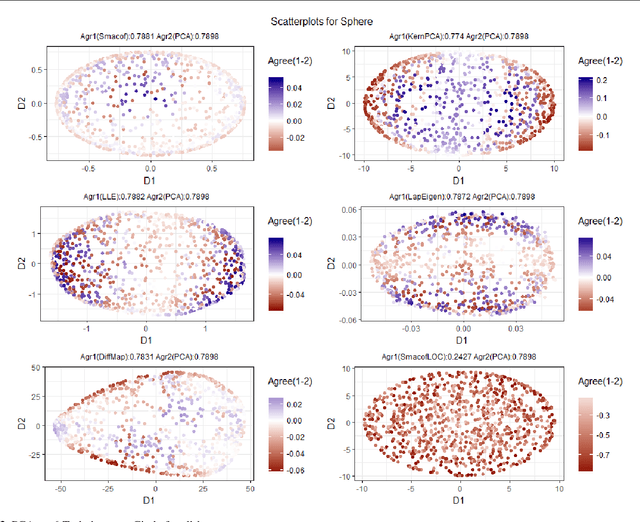
This paper gives a review and synthesis of methods of evaluating dimensionality reduction techniques. Particular attention is paid to rank-order neighborhood evaluation metrics. A framework is created for exploring dimensionality reduction quality through visualization. An associated toolkit is implemented in R. The toolkit includes scatter plots, heat maps, loess smoothing, and performance lift diagrams. The overall rationale is to help researchers compare dimensionality reduction techniques and use visual insights to help select and improve techniques. Examples are given for dimensionality reduction of manifolds and for the dimensionality reduction applied to a consumer survey dataset.
Marketing Analytics: Methods, Practice, Implementation, and Links to Other Fields
Jan 28, 2018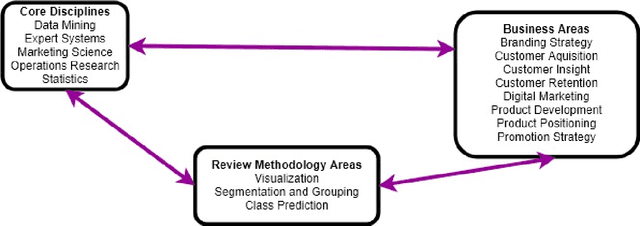
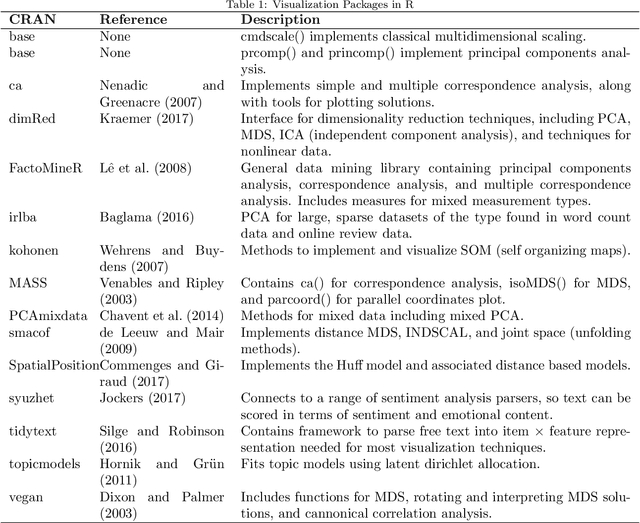
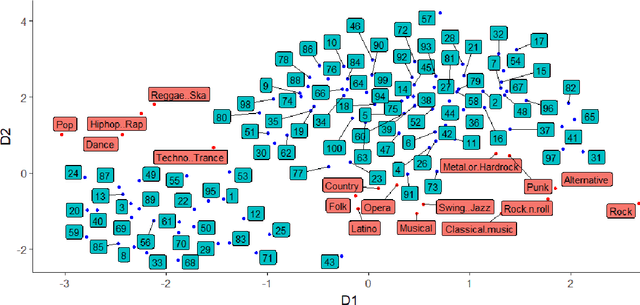
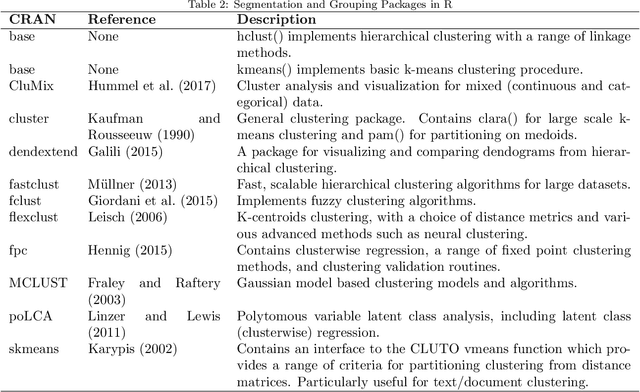
Marketing analytics is a diverse field, with both academic researchers and practitioners coming from a range of backgrounds including marketing, operations research, statistics, and computer science. This paper provides an integrative review at the boundary of these three areas. The topics of visualization, segmentation, and class prediction are featured. Links between the disciplines are emphasized. For each of these topics, a historical overview is given, starting with initial work in the 1960s and carrying through to the present day. Recent innovations for modern large and complex "big data" sets are described. Practical implementation advice is given, along with a directory of open source R routines for implementing marketing analytics techniques.