 Add to Chrome
 Add to Firefox
 Add to Edge
TinyBayes: Closed-Form Bayesian Inference via Jacobi Prior for Real-Time Image Classification on Edge Devices
May 07, 2026Cocoa (Theobroma cacao) is a critical cash crop for millions of smallholder farmers in West Africa, where Cocoa Swollen Shoot Virus Disease (CSSVD) and anthracnose cause devastating yield losses. Automated disease detection from leaf images is essential for early intervention, yet deploying such systems in resource-constrained settings demands models that are small, fast, and require no internet connectivity. Existing edge-deployable plant disease systems rely on end-to-end deep learning without uncertainty quantification, while Bayesian methods for edge devices focus on hardware-level inference architectures rather than agricultural applications. We bridge this gap with TinyBayes, the first framework to combine a closed-form Bayesian classifier with a mobile-grade computer vision pipeline for crop disease detection. Our pipeline uses YOLOv8-Nano (5.9 MB) for lesion localisation, MobileNetV3-Small (3.5 MB) for feature extraction, and the Jacobi prior; a Bayesian method that provides a closed form non-iterative estimators via projection, for the classification. The Jacobi-DMR (Distributed Multinomial Regression) classifier adds only 13.5 KB to the pipeline, bringing the total model size within 9.5 MB, while achieving 78.7% accuracy on the Amini Cocoa Contamination Challenge dataset and enabling end-to-end CPU inference under 150 ms per image. We benchmark against seven classifiers including Random Forest, SVM, Ridge, Lasso, Elastic Net, XGBoost, and Jacobi-GP, and demonstrate that the Jacobi-DMR offers the best trade-off between accuracy, model size, and inference speed for edge deployment. We have proved the asymptotic equivalence and consistency, asymptotic normality and the bias correction of Jacobi-DMR. All data and codes are available here: https://github.com/shouvik-sardar/TinyBayes
Causal Links Between Anthropogenic Emissions and Air Pollution Dynamics in Delhi
Mar 24, 2025Air pollution poses significant health and environmental challenges, particularly in rapidly urbanizing regions. Delhi-National Capital Region experiences air pollution episodes due to complex interactions between anthropogenic emissions and meteorological conditions. Understanding the causal drivers of key pollutants such as $PM_{2.5}$ and ground $O_3$ is crucial for developing effective mitigation strategies. This study investigates the causal links of anthropogenic emissions on $PM_{2.5}$ and $O_3$ concentrations using predictive modeling and causal inference techniques. Integrating high-resolution air quality data from Jan 2018 to Aug 2023 across 32 monitoring stations, we develop predictive regression models that incorporate meteorological variables (temperature and relative humidity), pollutant concentrations ($NO_2, SO_2, CO$), and seasonal harmonic components to capture both diurnal and annual cycles. Here, we show that reductions in anthropogenic emissions lead to significant decreases in $PM_{2.5}$ levels, whereas their effect on $O_3$ remains marginal and statistically insignificant. To address spatial heterogeneity, we employ Gaussian Process modeling. Further, we use Granger causality analysis and counterfactual simulation to establish direct causal links. Validation using real-world data from the COVID-19 lockdown confirms that reduced emissions led to a substantial drop in $PM_{2.5}$ but only a slight, insignificant change in $O_3$. The findings highlight the necessity of targeted emission reduction policies while emphasizing the need for integrated strategies addressing both particulate and ozone pollution. These insights are crucial for policymakers designing air pollution interventions in other megacities, and offer a scalable methodology for tackling complex urban air pollution through data-driven decision-making.
Prediction of COVID-19 Disease Progression in India : Under the Effect of National Lockdown
Apr 07, 2020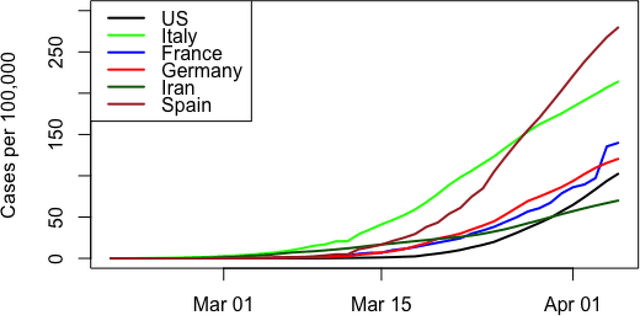
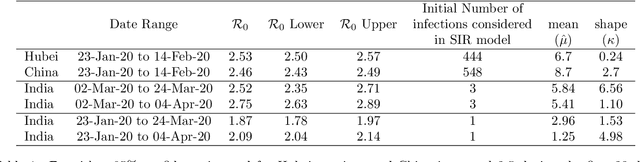
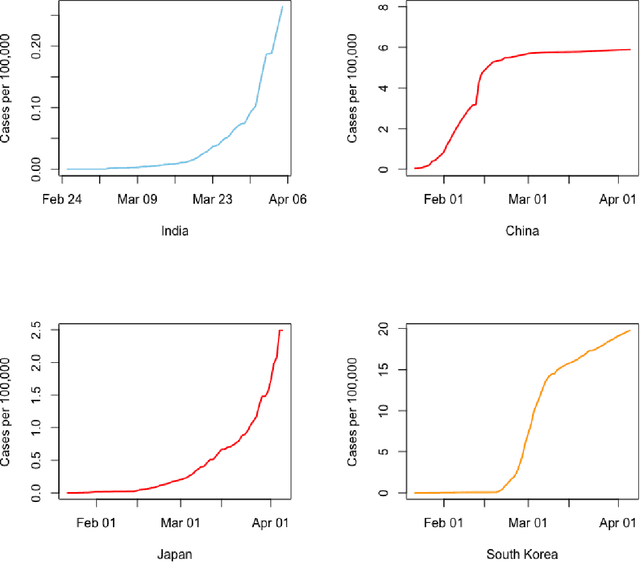
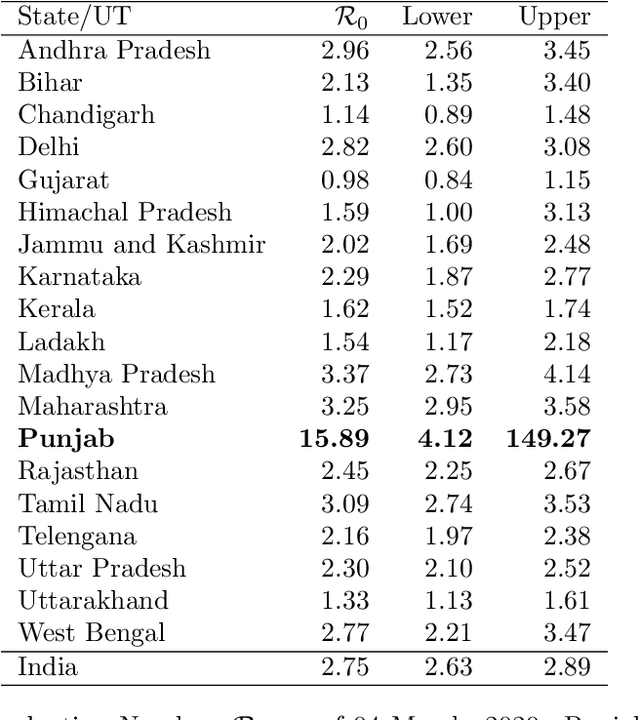
In this policy paper, we implement the epidemiological SIR to estimate the basic reproduction number $\mathcal{R}_0$ at national and state level. We also developed the statistical machine learning model to predict the cases ahead of time. Our analysis indicates that the situation of Punjab ($\mathcal{R}_0\approx 16$) is not good. It requires immediate aggressive attention. We see the $\mathcal{R}_0$ for Madhya Pradesh (3.37) , Maharastra (3.25) and Tamil Nadu (3.09) are more than 3. The $\mathcal{R}_0$ of Andhra Pradesh (2.96), Delhi (2.82) and West Bengal (2.77) is more than the India's $\mathcal{R}_0=2.75$, as of 04 March, 2020. India's $\mathcal{R}_0=2.75$ (as of 04 March, 2020) is very much comparable to Hubei/China at the early disease progression stage. Our analysis indicates that the early disease progression of India is that of similar to China. Therefore, with lockdown in place, India should expect as many as cases if not more like China. If lockdown works, we should expect less than 66,224 cases by May 01,2020. All data and \texttt{R} code for this paper is available from \url{https://github.com/sourish-cmi/Covid19}
A Bayesian Perspective of Statistical Machine Learning for Big Data
Nov 13, 2018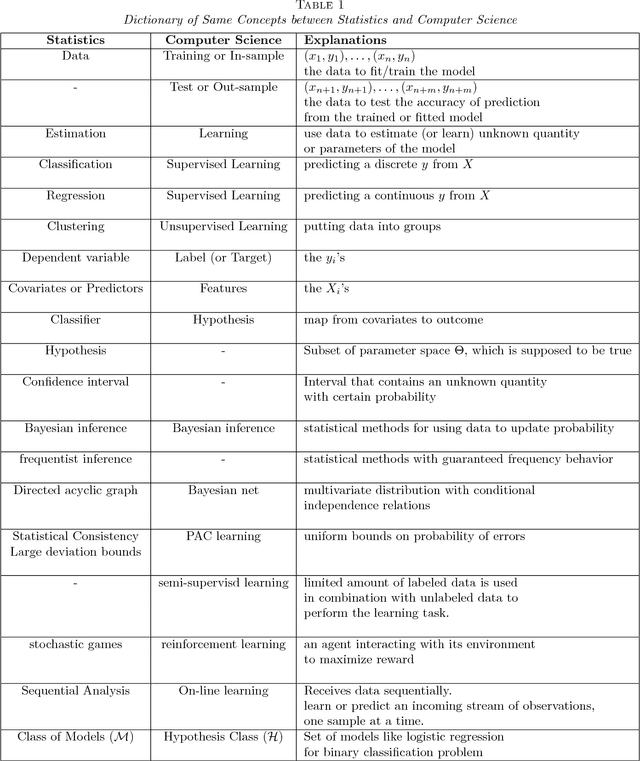
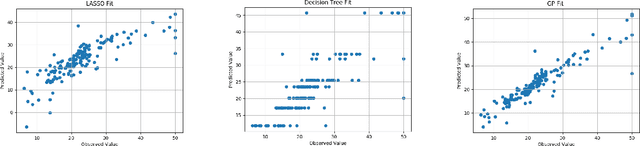
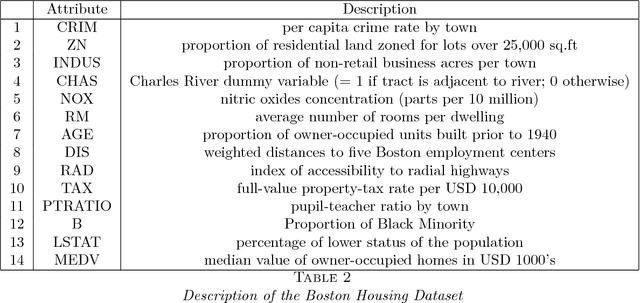
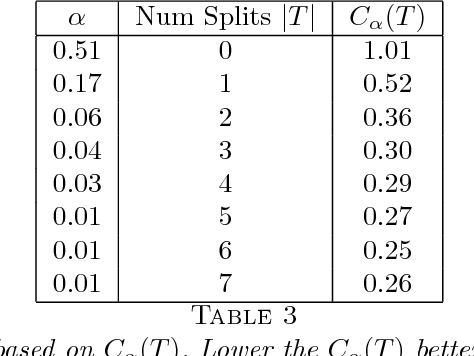
Statistical Machine Learning (SML) refers to a body of algorithms and methods by which computers are allowed to discover important features of input data sets which are often very large in size. The very task of feature discovery from data is essentially the meaning of the keyword `learning' in SML. Theoretical justifications for the effectiveness of the SML algorithms are underpinned by sound principles from different disciplines, such as Computer Science and Statistics. The theoretical underpinnings particularly justified by statistical inference methods are together termed as statistical learning theory. This paper provides a review of SML from a Bayesian decision theoretic point of view -- where we argue that many SML techniques are closely connected to making inference by using the so called Bayesian paradigm. We discuss many important SML techniques such as supervised and unsupervised learning, deep learning, online learning and Gaussian processes especially in the context of very large data sets where these are often employed. We present a dictionary which maps the key concepts of SML from Computer Science and Statistics. We illustrate the SML techniques with three moderately large data sets where we also discuss many practical implementation issues. Thus the review is especially targeted at statisticians and computer scientists who are aspiring to understand and apply SML for moderately large to big data sets.
Clustering Mixed Datasets Using Homogeneity Analysis with Applications to Big Data
Oct 30, 2017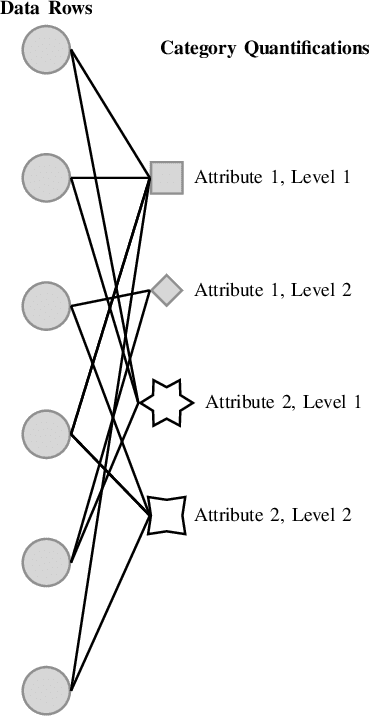
Datasets with a mixture of numerical and categorical attributes are routinely encountered in many application domains. In this work we examine an approach to clustering such datasets using homogeneity analysis. Homogeneity analysis determines a euclidean representation of the data. This can be analyzed by leveraging the large body of tools and techniques for data with a euclidean representation. Experiments conducted as part of this study suggest that this approach can be useful in the analysis and exploration of big datasets with a mixture of numerical and categorical attributes.
Big Data Classification Using Augmented Decision Trees
Oct 26, 2017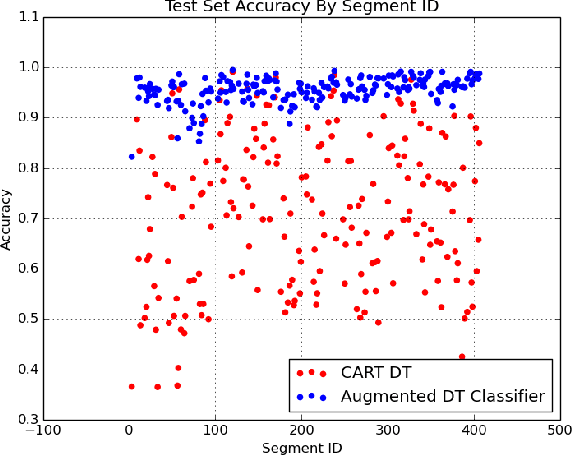
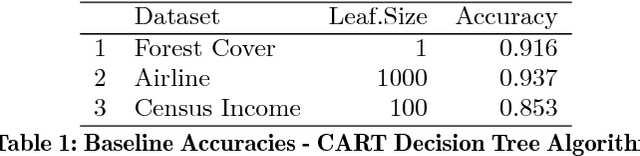
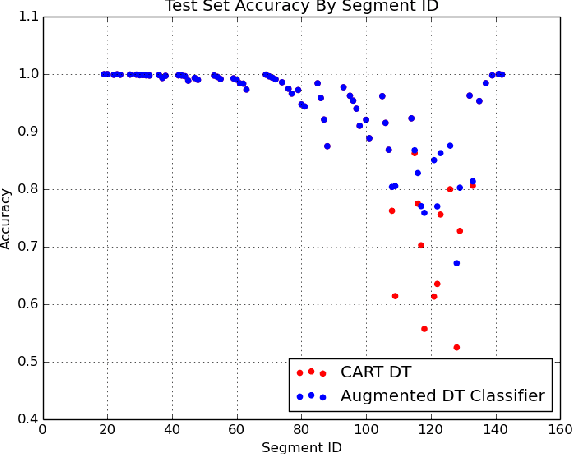
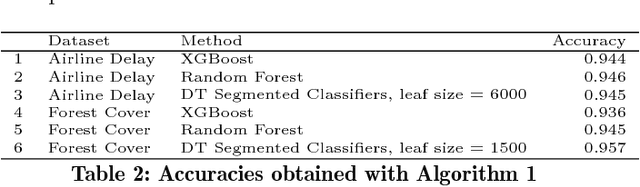
We present an algorithm for classification tasks on big data. Experiments conducted as part of this study indicate that the algorithm can be as accurate as ensemble methods such as random forests or gradient boosted trees. Unlike ensemble methods, the models produced by the algorithm can be easily interpreted. The algorithm is based on a divide and conquer strategy and consists of two steps. The first step consists of using a decision tree to segment the large dataset. By construction, decision trees attempt to create homogeneous class distributions in their leaf nodes. However, non-homogeneous leaf nodes are usually produced. The second step of the algorithm consists of using a suitable classifier to determine the class labels for the non-homogeneous leaf nodes. The decision tree segment provides a coarse segment profile while the leaf level classifier can provide information about the attributes that affect the label within a segment.
Fast Gaussian Process Regression for Big Data
Aug 19, 2017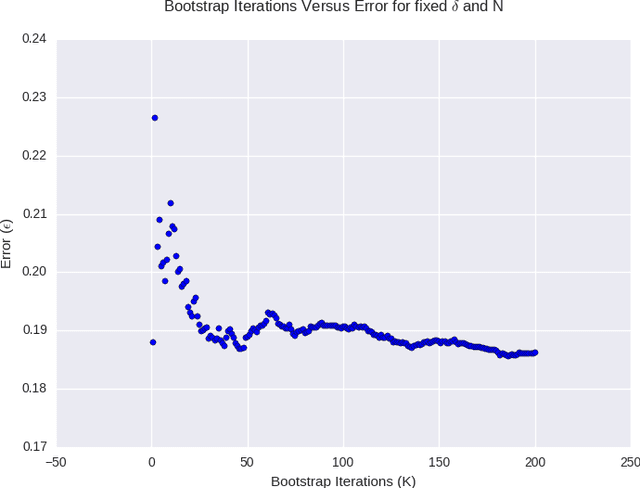
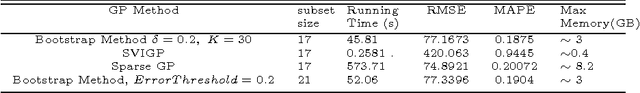
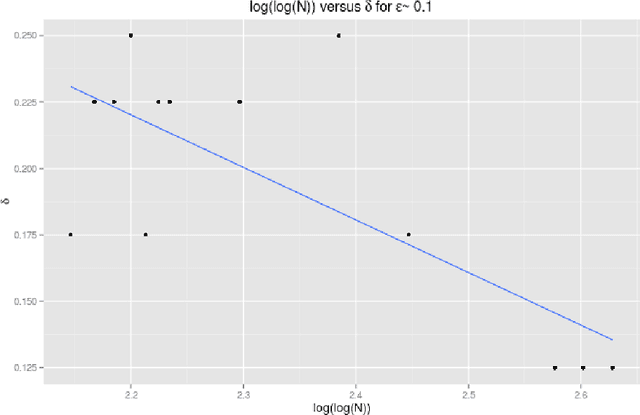
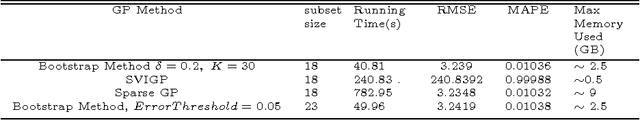
Gaussian Processes are widely used for regression tasks. A known limitation in the application of Gaussian Processes to regression tasks is that the computation of the solution requires performing a matrix inversion. The solution also requires the storage of a large matrix in memory. These factors restrict the application of Gaussian Process regression to small and moderate size data sets. We present an algorithm that combines estimates from models developed using subsets of the data obtained in a manner similar to the bootstrap. The sample size is a critical parameter for this algorithm. Guidelines for reasonable choices of algorithm parameters, based on detailed experimental study, are provided. Various techniques have been proposed to scale Gaussian Processes to large scale regression tasks. The most appropriate choice depends on the problem context. The proposed method is most appropriate for problems where an additive model works well and the response depends on a small number of features. The minimax rate of convergence for such problems is attractive and we can build effective models with a small subset of the data. The Stochastic Variational Gaussian Process and the Sparse Gaussian Process are also appropriate choices for such problems. These methods pick a subset of data based on theoretical considerations. The proposed algorithm uses bagging and random sampling. Results from experiments conducted as part of this study indicate that the algorithm presented in this work can be as effective as these methods. Model stacking can be used to combine the model developed with the proposed method with models from other methods for large scale regression such as Gradient Boosted Trees. This can yield performance gains.
Big Data Regression Using Tree Based Segmentation
Jul 25, 2017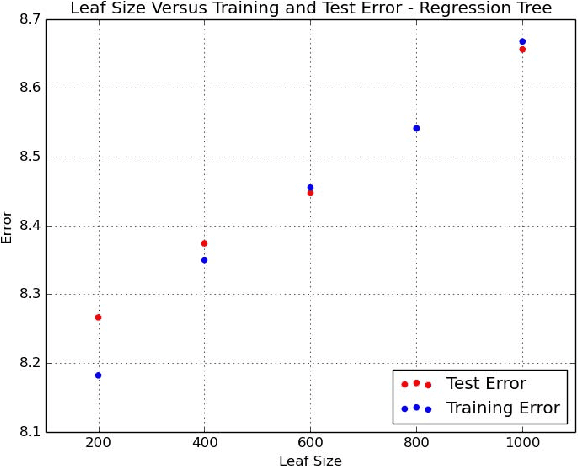
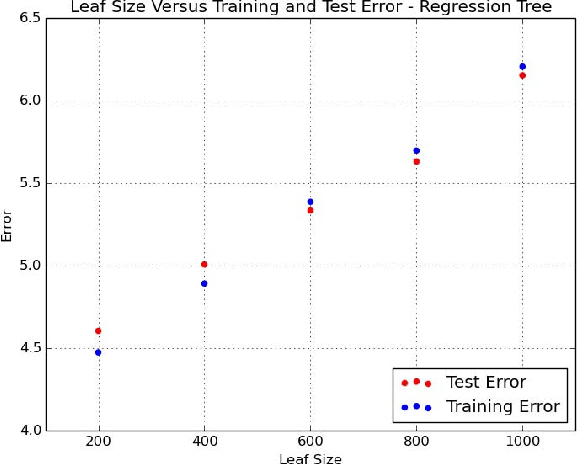
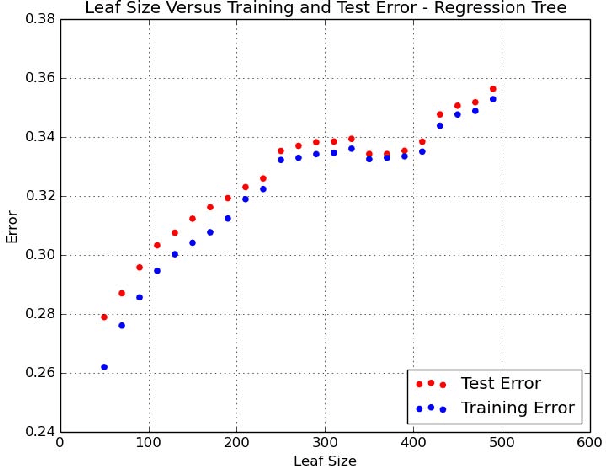
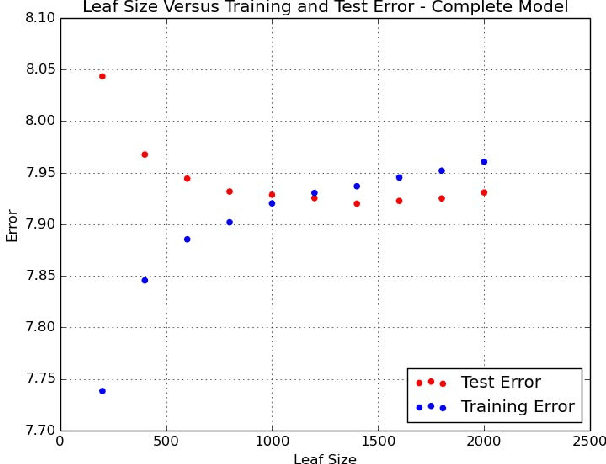
Scaling regression to large datasets is a common problem in many application areas. We propose a two step approach to scaling regression to large datasets. Using a regression tree (CART) to segment the large dataset constitutes the first step of this approach. The second step of this approach is to develop a suitable regression model for each segment. Since segment sizes are not very large, we have the ability to apply sophisticated regression techniques if required. A nice feature of this two step approach is that it can yield models that have good explanatory power as well as good predictive performance. Ensemble methods like Gradient Boosted Trees can offer excellent predictive performance but may not provide interpretable models. In the experiments reported in this study, we found that the predictive performance of the proposed approach matched the predictive performance of Gradient Boosted Trees.
A Statistical Machine Learning Approach to Yield Curve Forecasting
Mar 04, 2017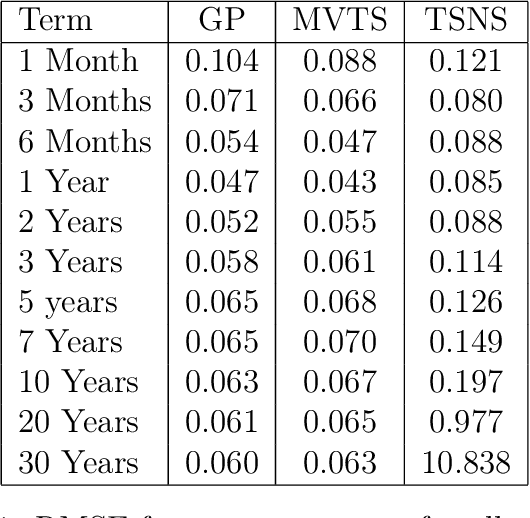
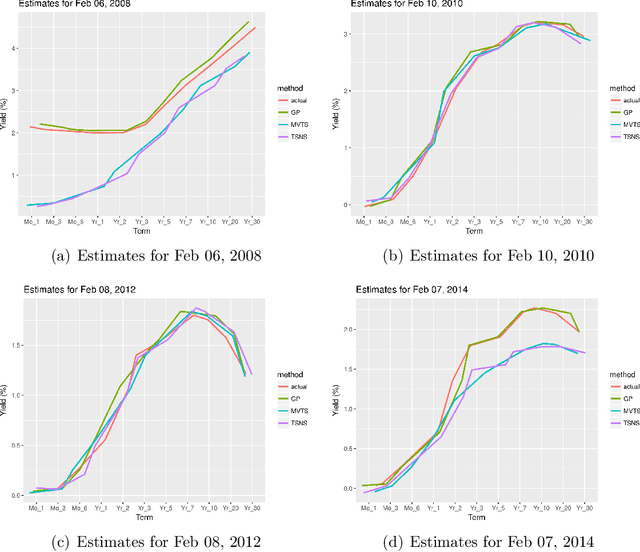
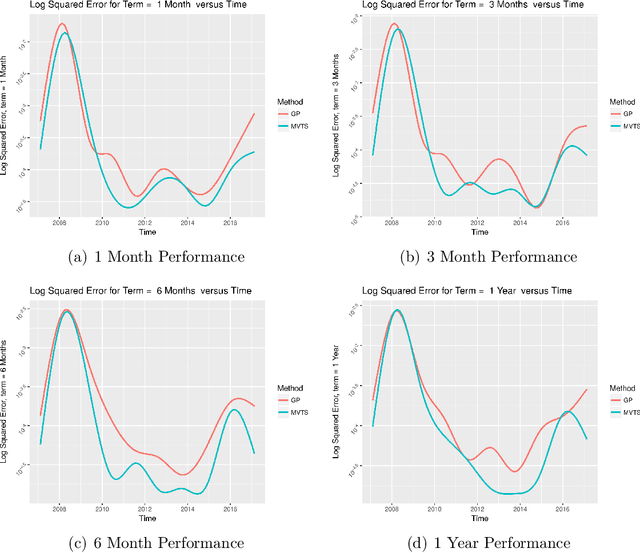
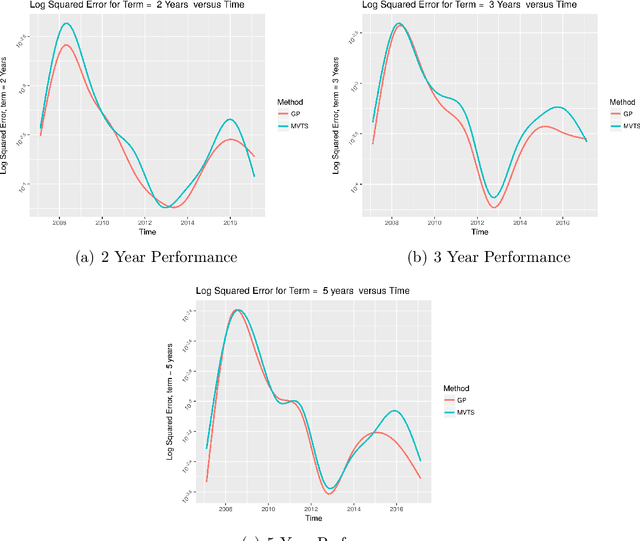
Yield curve forecasting is an important problem in finance. In this work we explore the use of Gaussian Processes in conjunction with a dynamic modeling strategy, much like the Kalman Filter, to model the yield curve. Gaussian Processes have been successfully applied to model functional data in a variety of applications. A Gaussian Process is used to model the yield curve. The hyper-parameters of the Gaussian Process model are updated as the algorithm receives yield curve data. Yield curve data is typically available as a time series with a frequency of one day. We compare existing methods to forecast the yield curve with the proposed method. The results of this study showed that while a competing method (a multivariate time series method) performed well in forecasting the yields at the short term structure region of the yield curve, Gaussian Processes perform well in the medium and long term structure regions of the yield curve. Accuracy in the long term structure region of the yield curve has important practical implications. The Gaussian Process framework yields uncertainty and probability estimates directly in contrast to other competing methods. Analysts are frequently interested in this information. In this study the proposed method has been applied to yield curve forecasting, however it can be applied to model high frequency time series data or data streams in other domains.