 Add to Chrome
 Add to Firefox
 Add to Edge
cGAP: Generalized Association Plots with HOMALS-Guided Heatmaps for Visualization of High-Dimensional Categorical Data
Jul 16, 2026
High-dimensional categorical data arise in genetics, biomedicine, and the social sciences, yet visualization tools for such data remain far less developed than those for continuous variables. Existing methods either scale poorly, rely heavily on low-dimensional displays detached from the original data matrix, or prioritize predictive accuracy over interpretability. To address this gap, we introduce categorical Generalized Association Plots (cGAP), a visualization framework for nominal, ordinal, and binary data that preserves the original data matrix while augmenting it with interpretable geometric structure. cGAP uses Homogeneity Analysis (HOMALS) to embed subjects and category levels in a three-dimensional Euclidean space and maps the embedding to red-green-blue coordinates so that similar patterns receive similar colors. The framework integrates three coordinated views: a HOMALS-guided heatmap of the raw data matrix, a subject proximity matrix, and a variable proximity matrix. Seriation algorithms are then used to reorder rows and columns to reveal coherent clusters, outliers, and local-to-global structure. We also derive barycentric traceability, projection-distortion, and contrast-preservation properties that clarify how embedding geometry is transferred to the display. We demonstrate the versatility of cGAP through applications to student-animal classification data, mammalian dentition profiles, mushroom records from the UCI Machine Learning Repository, and the Clusters of Orthologous Genes database. These examples show that cGAP supports transparent exploratory analysis by maintaining traceability between derived visual structure and the original categorical observations. cGAP provides a full-matrix, heatmap-based visualization environment for investigating complex categorical datasets across scientific domains.

Distance for Functional Data Clustering Based on Smoothing Parameter Commutation
Apr 10, 2016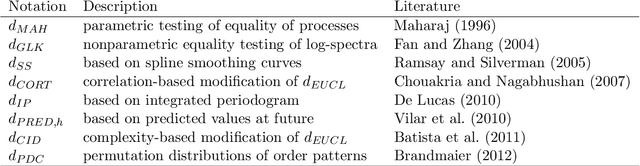
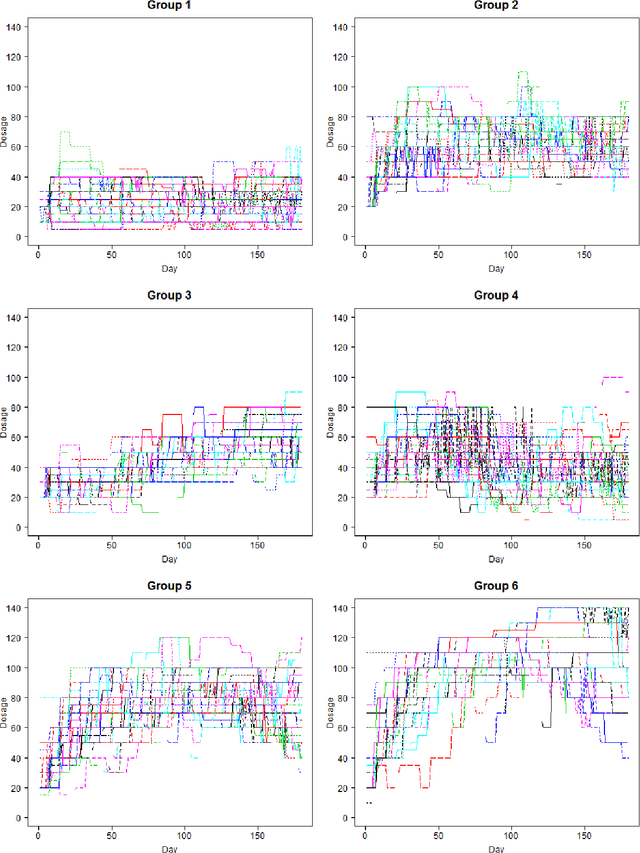
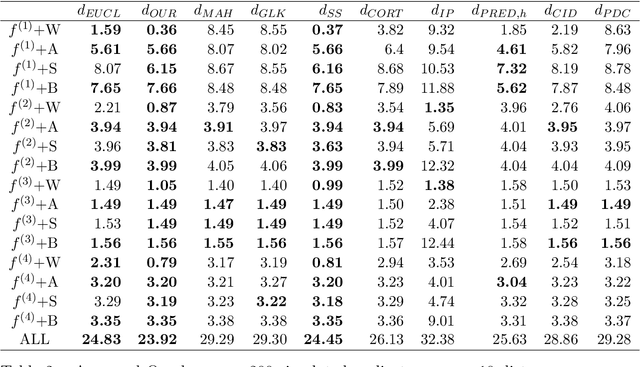
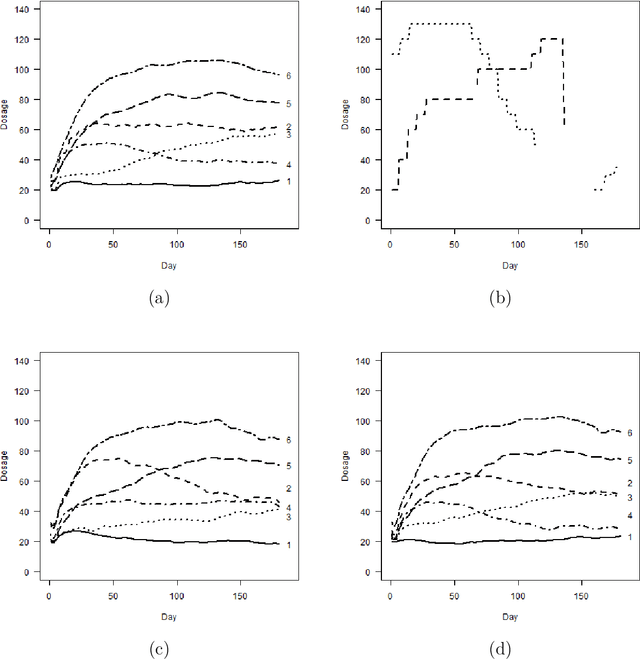
We propose a novel method to determine the dissimilarity between subjects for functional data clustering. Spline smoothing or interpolation is common to deal with data of such type. Instead of estimating the best-representing curve for each subject as fixed during clustering, we measure the dissimilarity between subjects based on varying curve estimates with commutation of smoothing parameters pair-by-pair (of subjects). The intuitions are that smoothing parameters of smoothing splines reflect inverse signal-to-noise ratios and that applying an identical smoothing parameter the smoothed curves for two similar subjects are expected to be close. The effectiveness of our proposal is shown through simulations comparing to other dissimilarity measures. It also has several pragmatic advantages. First, missing values or irregular time points can be handled directly, thanks to the nature of smoothing splines. Second, conventional clustering method based on dissimilarity can be employed straightforward, and the dissimilarity also serves as a useful tool for outlier detection. Third, the implementation is almost handy since subroutines for smoothing splines and numerical integration are widely available. Fourth, the computational complexity does not increase and is parallel with that in calculating Euclidean distance between curves estimated by smoothing splines.