 Add to Chrome
 Add to Firefox
 Add to Edge
Reference-based and No-reference Metrics to Evaluate Explanation Methods of AI -- CNNs in Image Classification Tasks
Dec 23, 2022The most popular methods in AI-machine learning paradigm are mainly black boxes. This is why explanation of AI decisions is of emergency. Although dedicated explanation tools have been massively developed, the evaluation of their quality remains an open research question. In this paper, we the generalize the methodologies of evaluation of post-hoc explainers of CNNs' decisions in visual classification tasks with reference and no-reference based metrics. We apply them on our previously developed explainers (FEM, MLFEM), and popular Grad-CAM. The reference-based metrics are Pearson correlation coefficient and Similarity computed between the explanation map and its ground truth represented by a Gaze Fixation Density Map obtained with a psycho-visual experiment. As a no-reference metric we use stability metric, proposed by Alvarez-Melis and Jaakkola. We study its behaviour, consensus with reference-based metrics and show that in case of several kind of degradation on input images, this metric is in agreement with reference-based ones. Therefore it can be used for evaluation of the quality of explainers when the ground truth is not available.
Toward automatic comparison of visualization techniques: Application to graph visualization
Oct 21, 2019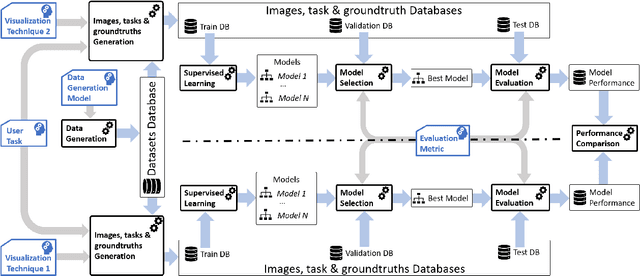
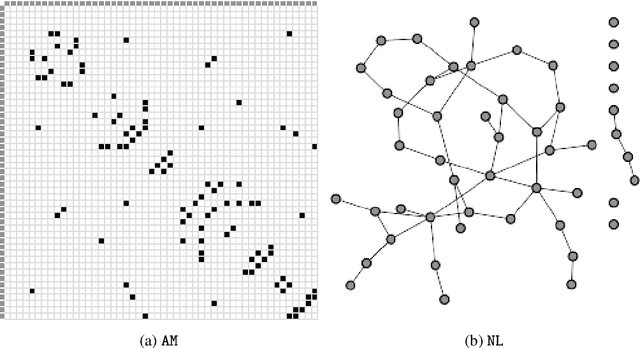
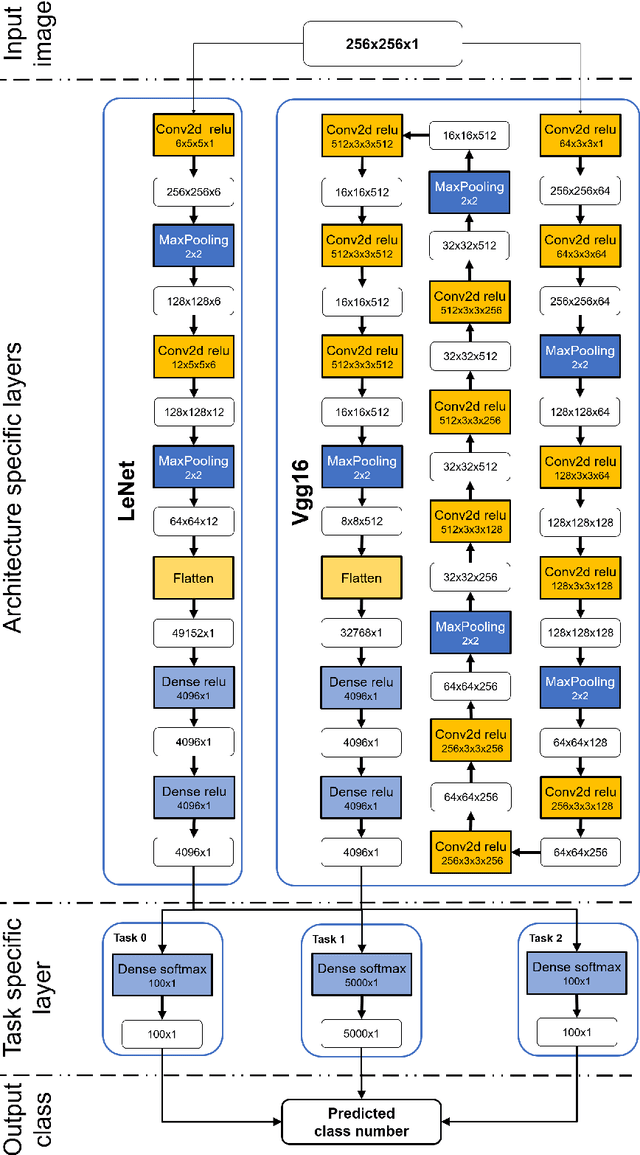
Many end-user evaluations of data visualization techniques have been run during the last decades. Their results are cornerstones to build efficient visualization systems. However, designing an evaluation is always complex and time-consuming and may end in a lack of statistical evidence. The raising of modern efficient computer vision techniques may help visualization researchers to adjust their evaluation hypothesis and thus reduces the risk of failure. In this paper, we present a methodology that uses such computer vision techniques to automatically compare the efficiency of several visualization techniques. The basis of our methodology is to generate a set of images for each compared visualization technique from a common dataset and to train machine learning models (one for each set and visualization technique) to solve a given task. Our assumption is that the performance of each model allows to compare the efficiencies of the corresponding visualization techniques; as current machine learning models are not capable enough to reflect human capabilities, including their imperfections, such results should be interpreted with caution. However, we argue that using machine learning-based evaluation as a pre-process of standard user evaluations should help researchers to perform a more exhaustive study of the design space and thus should improve the final user evaluation by providing better test cases. To show that our methodology can reproduce, up to a certain level, results of user evaluations, we applied it to compare two mainstream graph visualization techniques: node-link (NL) and adjacency-matrix (MD) diagrams. We partially reproduced a user evaluation from Ghoniem et al. using two well-known deep convolutional neural networks as machine learning-based systems. Our results show up that Ghoniem et al. results can be reproduced automatically at a larger scale with our system.