 Add to Chrome
 Add to Firefox
 Add to Edge
LGB+: A Macroeconomic Forecasting Road Test
May 10, 2026Needless to say, linear dynamics are pervasive in economic time series, particularly autoregressive ones. While gradient boosting with trees excels at capturing nonlinearities, it is inefficient in small samples when much of the predictive content is linear, expending splits to approximate relationships better captured by simple linear terms. This paper proposes LGB+, a boosting procedure operating on a more inclusive set of basis functions. The idea comes in two flavors. LGB+ evaluates a tree and a linear candidate at each step against out-of-bag data; only the winner advances. The simpler variant, LGB^A+, alternates on a fixed schedule: a block of tree updates, then a greedy linear correction, repeat. Both designs avoid ex ante commitments to any particular functional form or predictor selection. Because the prediction is the sum of a linear and a tree component, forecasts decompose natively into linear and nonlinear contributions, and so does permutation-based variable importance and historical proximity weights. In a quarterly U.S. macroeconomic forecasting exercise, LGB+ delivers strong gains for targets with pronounced autoregressive dynamics or mixed linear-nonlinear signals. Variables dominating the linear channel are those operating through autoregressive persistence or near-accounting relationships to the target (e.g., initial claims for unemployment and building permits for housing starts).
Quantifying the Risk-Return Tradeoff in Forecasting
May 10, 2026Average forecast accuracy is not the same as forecast reliability. I treat forecast loss differentials relative to a benchmark as a return series. I then evaluate these returns using risk-adjusted performance measures from finance, including the Sharpe ratio, Sortino ratio, Omega ratio, and drawdown-based metrics. I also introduce the Edge Ratio capturing a model's propensity to deliver uniquely informative predictions relative to the forecasting frontier. I apply this framework to U.S. macroeconomic forecasting, comparing econometric benchmarks, machine learning models, a foundation model (TabPFN), and the Survey of Professional Forecasters. While it is often feasible to beat professional forecasters in terms of average accuracy, it is much harder to beat them on a risk-adjusted basis. They rarely exhibit catastrophic failures and often achieve high Edge Ratios, plausibly reflecting the value of contextual judgment. Nonetheless, selected machine learning methods deliver attractive risk profiles for specific targets. The framework naturally extends to meta-analyses across targets, horizons, and samples, illustrated with a density forecast evaluation and the M4 competition.
Opening the Black Box of Local Projections
May 18, 2025Local projections (LPs) are widely used in empirical macroeconomics to estimate impulse responses to policy interventions. Yet, in many ways, they are black boxes. It is often unclear what mechanism or historical episodes drive a particular estimate. We introduce a new decomposition of LP estimates into the sum of contributions of historical events, which is the product, for each time stamp, of a weight and the realization of the response variable. In the least squares case, we show that these weights admit two interpretations. First, they represent purified and standardized shocks. Second, they serve as proximity scores between the projected policy intervention and past interventions in the sample. Notably, this second interpretation extends naturally to machine learning methods, many of which yield impulse responses that, while nonlinear in predictors, still aggregate past outcomes linearly via proximity-based weights. Applying this framework to shocks in monetary and fiscal policy, global temperature, and the excess bond premium, we find that easily identifiable events-such as Nixon's interference with the Fed, stagflation, World War II, and the Mount Agung volcanic eruption-emerge as dominant drivers of often heavily concentrated impulse response estimates.
Ordinary Least Squares as an Attention Mechanism
Apr 13, 2025I show that ordinary least squares (OLS) predictions can be rewritten as the output of a restricted attention module, akin to those forming the backbone of large language models. This connection offers an alternative perspective on attention beyond the conventional information retrieval framework, making it more accessible to researchers and analysts with a background in traditional statistics. It falls into place when OLS is framed as a similarity-based method in a transformed regressor space, distinct from the standard view based on partial correlations. In fact, the OLS solution can be recast as the outcome of an alternative problem: minimizing squared prediction errors by optimizing the embedding space in which training and test vectors are compared via inner products. Rather than estimating coefficients directly, we equivalently learn optimal encoding and decoding operations for predictors. From this vantage point, OLS maps naturally onto the query-key-value structure of attention mechanisms. Building on this foundation, I discuss key elements of Transformer-style attention and draw connections to classic ideas from time series econometrics.
Dual Interpretation of Machine Learning Forecasts
Dec 17, 2024Machine learning predictions are typically interpreted as the sum of contributions of predictors. Yet, each out-of-sample prediction can also be expressed as a linear combination of in-sample values of the predicted variable, with weights corresponding to pairwise proximity scores between current and past economic events. While this dual route leads nowhere in some contexts (e.g., large cross-sectional datasets), it provides sparser interpretations in settings with many regressors and little training data-like macroeconomic forecasting. In this case, the sequence of contributions can be visualized as a time series, allowing analysts to explain predictions as quantifiable combinations of historical analogies. Moreover, the weights can be viewed as those of a data portfolio, inspiring new diagnostic measures such as forecast concentration, short position, and turnover. We show how weights can be retrieved seamlessly for (kernel) ridge regression, random forest, boosted trees, and neural networks. Then, we apply these tools to analyze post-pandemic forecasts of inflation, GDP growth, and recession probabilities. In all cases, the approach opens the black box from a new angle and demonstrates how machine learning models leverage history partly repeating itself.
Maximally Forward-Looking Core Inflation
Apr 08, 2024Timely monetary policy decision-making requires timely core inflation measures. We create a new core inflation series that is explicitly designed to succeed at that goal. Precisely, we introduce the Assemblage Regression, a generalized nonnegative ridge regression problem that optimizes the price index's subcomponent weights such that the aggregate is maximally predictive of future headline inflation. Ordering subcomponents according to their rank in each period switches the algorithm to be learning supervised trimmed inflation - or, put differently, the maximally forward-looking summary statistic of the realized price changes distribution. In an extensive out-of-sample forecasting experiment for the US and the euro area, we find substantial improvements for signaling medium-term inflation developments in both the pre- and post-Covid years. Those coming from the supervised trimmed version are particularly striking, and are attributable to a highly asymmetric trimming which contrasts with conventional indicators. We also find that this metric was indicating first upward pressures on inflation as early as mid-2020 and quickly captured the turning point in 2022. We also consider extensions, like assembling inflation from geographical regions, trimmed temporal aggregation, and building core measures specialized for either upside or downside inflation risks.
From Reactive to Proactive Volatility Modeling with Hemisphere Neural Networks
Nov 27, 2023


We reinvigorate maximum likelihood estimation (MLE) for macroeconomic density forecasting through a novel neural network architecture with dedicated mean and variance hemispheres. Our architecture features several key ingredients making MLE work in this context. First, the hemispheres share a common core at the entrance of the network which accommodates for various forms of time variation in the error variance. Second, we introduce a volatility emphasis constraint that breaks mean/variance indeterminacy in this class of overparametrized nonlinear models. Third, we conduct a blocked out-of-bag reality check to curb overfitting in both conditional moments. Fourth, the algorithm utilizes standard deep learning software and thus handles large data sets - both computationally and statistically. Ergo, our Hemisphere Neural Network (HNN) provides proactive volatility forecasts based on leading indicators when it can, and reactive volatility based on the magnitude of previous prediction errors when it must. We evaluate point and density forecasts with an extensive out-of-sample experiment and benchmark against a suite of models ranging from classics to more modern machine learning-based offerings. In all cases, HNN fares well by consistently providing accurate mean/variance forecasts for all targets and horizons. Studying the resulting volatility paths reveals its versatility, while probabilistic forecasting evaluation metrics showcase its enviable reliability. Finally, we also demonstrate how this machinery can be merged with other structured deep learning models by revisiting Goulet Coulombe (2022)'s Neural Phillips Curve.
Maximally Machine-Learnable Portfolios
Jun 08, 2023When it comes to stock returns, any form of predictability can bolster risk-adjusted profitability. We develop a collaborative machine learning algorithm that optimizes portfolio weights so that the resulting synthetic security is maximally predictable. Precisely, we introduce MACE, a multivariate extension of Alternating Conditional Expectations that achieves the aforementioned goal by wielding a Random Forest on one side of the equation, and a constrained Ridge Regression on the other. There are two key improvements with respect to Lo and MacKinlay's original maximally predictable portfolio approach. First, it accommodates for any (nonlinear) forecasting algorithm and predictor set. Second, it handles large portfolios. We conduct exercises at the daily and monthly frequency and report significant increases in predictability and profitability using very little conditioning information. Interestingly, predictability is found in bad as well as good times, and MACE successfully navigates the debacle of 2022.
A Neural Phillips Curve and a Deep Output Gap
Feb 08, 2022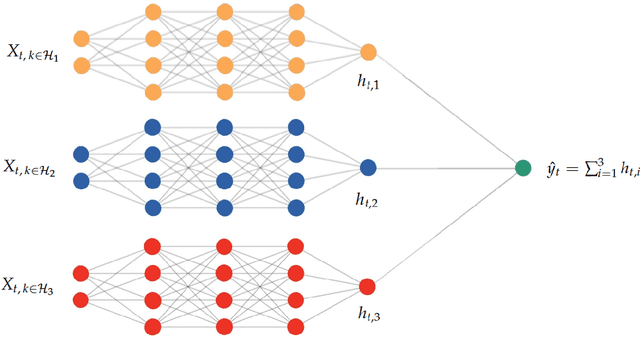
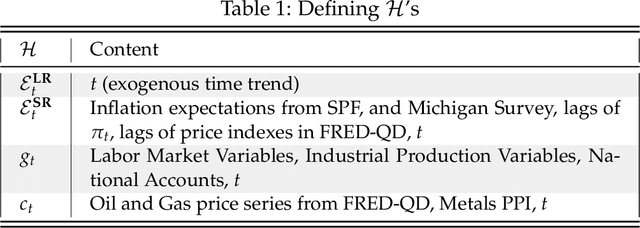
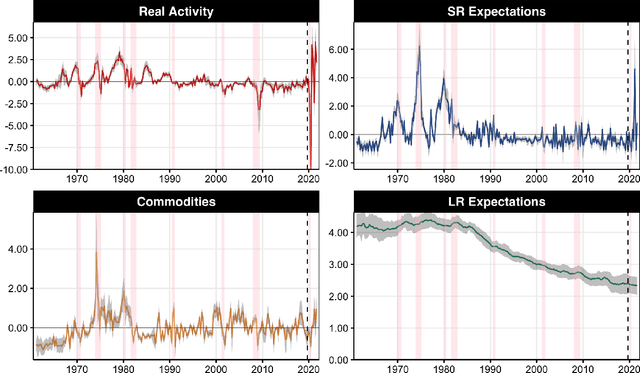
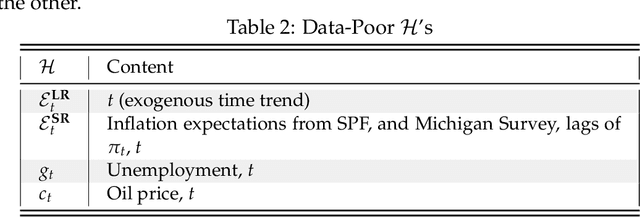
Many problems plague the estimation of Phillips curves. Among them is the hurdle that the two key components, inflation expectations and the output gap, are both unobserved. Traditional remedies include creating reasonable proxies for the notable absentees or extracting them via some form of assumptions-heavy filtering procedure. I propose an alternative route: a Hemisphere Neural Network (HNN) whose peculiar architecture yields a final layer where components can be interpreted as latent states within a Neural Phillips Curve. There are benefits. First, HNN conducts the supervised estimation of nonlinearities that arise when translating a high-dimensional set of observed regressors into latent states. Second, computations are fast. Third, forecasts are economically interpretable. Fourth, inflation volatility can also be predicted by merely adding a hemisphere to the model. Among other findings, the contribution of real activity to inflation appears severely underestimated in traditional econometric specifications. Also, HNN captures out-of-sample the 2021 upswing in inflation and attributes it first to an abrupt and sizable disanchoring of the expectations component, followed by a wildly positive gap starting from late 2020. HNN's gap unique path comes from dispensing with unemployment and GDP in favor of an amalgam of nonlinearly processed alternative tightness indicators -- some of which are skyrocketing as of early 2022.
Slow-Growing Trees
Mar 02, 2021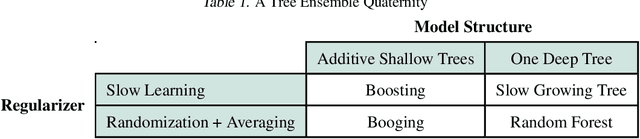
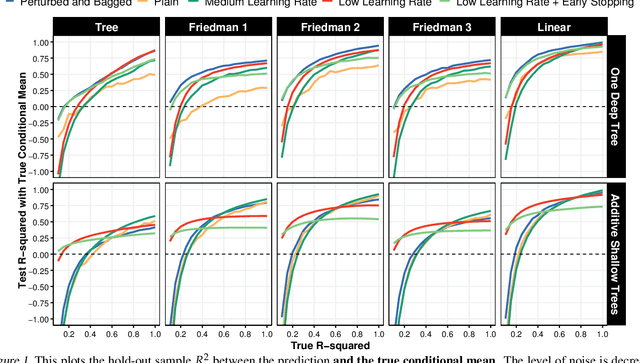
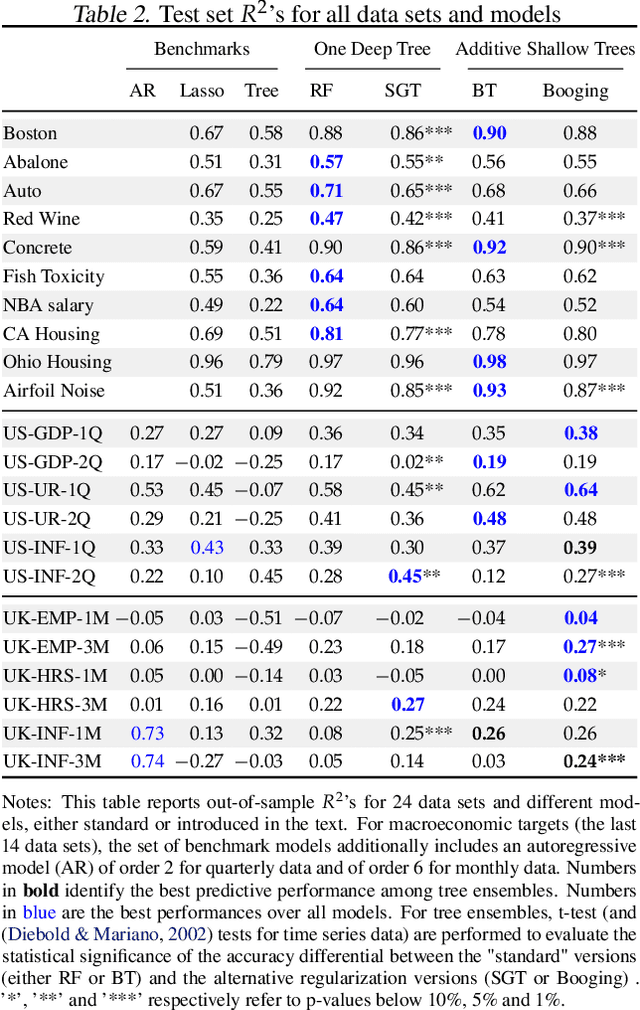
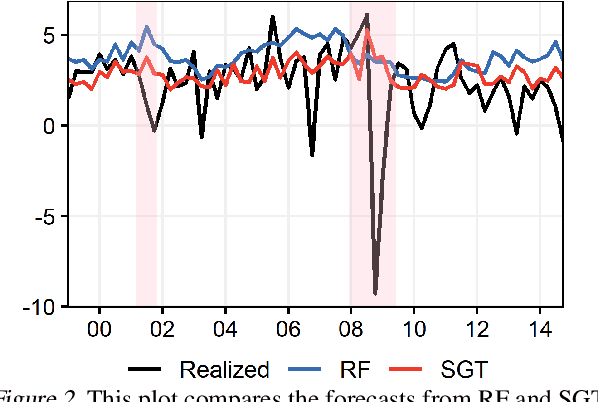
Random Forest's performance can be matched by a single slow-growing tree (SGT), which uses a learning rate to tame CART's greedy algorithm. SGT exploits the view that CART is an extreme case of an iterative weighted least square procedure. Moreover, a unifying view of Boosted Trees (BT) and Random Forests (RF) is presented. Greedy ML algorithms' outcomes can be improved using either "slow learning" or diversification. SGT applies the former to estimate a single deep tree, and Booging (bagging stochastic BT with a high learning rate) uses the latter with additive shallow trees. The performance of this tree ensemble quaternity (Booging, BT, SGT, RF) is assessed on simulated and real regression tasks.