 Add to Chrome
 Add to Firefox
 Add to Edge
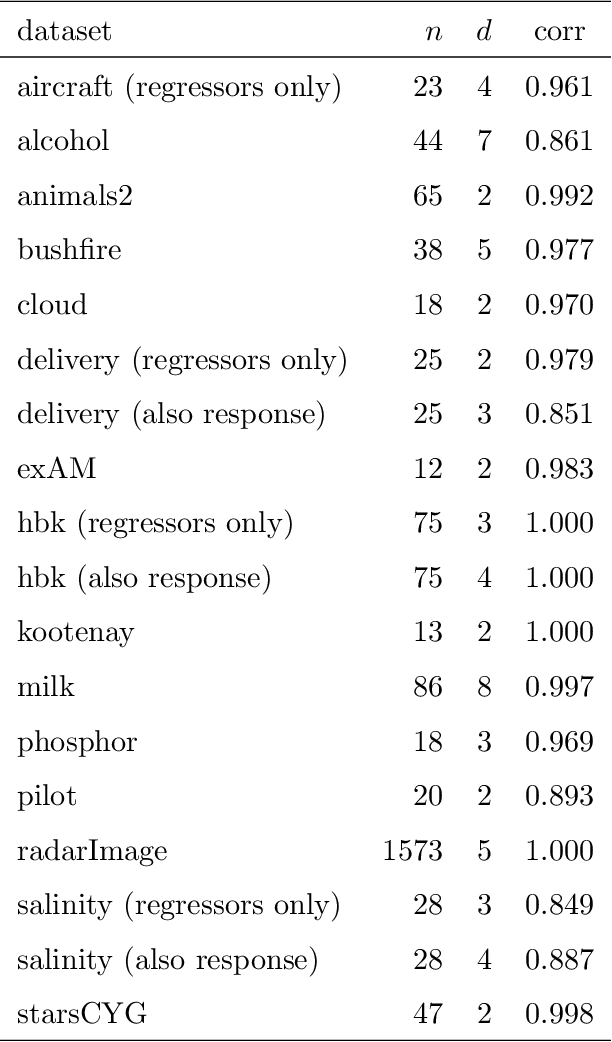
Cellwise and Casewise Robust Covariance in High Dimensions
May 26, 2025The sample covariance matrix is a cornerstone of multivariate statistics, but it is highly sensitive to outliers. These can be casewise outliers, such as cases belonging to a different population, or cellwise outliers, which are deviating cells (entries) of the data matrix. Recently some robust covariance estimators have been developed that can handle both types of outliers, but their computation is only feasible up to at most 20 dimensions. To remedy this we propose the cellRCov method, a robust covariance estimator that simultaneously handles casewise outliers, cellwise outliers, and missing data. It relies on a decomposition of the covariance on principal and orthogonal subspaces, leveraging recent work on robust PCA. It also employs a ridge-type regularization to stabilize the estimated covariance matrix. We establish some theoretical properties of cellRCov, including its casewise and cellwise influence functions as well as consistency and asymptotic normality. A simulation study demonstrates the superior performance of cellRCov in contaminated and missing data scenarios. Furthermore, its practical utility is illustrated in a real-world application to anomaly detection. We also construct and illustrate the cellRCCA method for robust and regularized canonical correlation analysis.
Independent Component Analysis by Robust Distance Correlation
May 14, 2025Independent component analysis (ICA) is a powerful tool for decomposing a multivariate signal or distribution into fully independent sources, not just uncorrelated ones. Unfortunately, most approaches to ICA are not robust against outliers. Here we propose a robust ICA method called RICA, which estimates the components by minimizing a robust measure of dependence between multivariate random variables. The dependence measure used is the distance correlation (dCor). In order to make it more robust we first apply a new transformation called the bowl transform, which is bounded, one-to-one, continuous, and maps far outliers to points close to the origin. This preserves the crucial property that a zero dCor implies independence. RICA estimates the independent sources sequentially, by looking for the component that has the smallest dCor with the remainder. RICA is strongly consistent and has the usual parametric rate of convergence. Its robustness is investigated by a simulation study, in which it generally outperforms its competitors. The method is illustrated on three applications, including the well-known cocktail party problem.
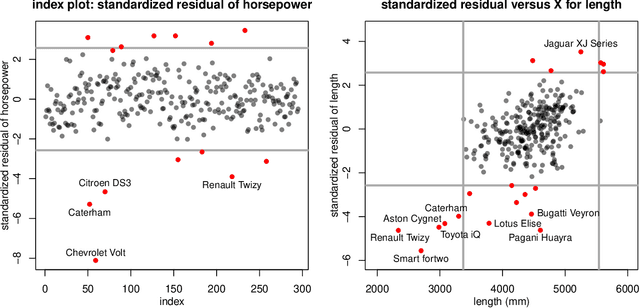
RobPy: a Python Package for Robust Statistical Methods
Nov 04, 2024Robust estimation provides essential tools for analyzing data that contain outliers, ensuring that statistical models remain reliable even in the presence of some anomalous data. While robust methods have long been available in R, users of Python have lacked a comprehensive package that offers these methods in a cohesive framework. RobPy addresses this gap by offering a wide range of robust methods in Python, built upon established libraries including NumPy, SciPy, and scikit-learn. This package includes tools for robust preprocessing, univariate estimation, covariance matrices, regression, and principal component analysis, which are able to detect outliers and to mitigate their effect. In addition, RobPy provides specialized diagnostic plots for visualizing casewise and cellwise outliers. This paper presents the structure of the RobPy package, demonstrates its functionality through examples, and compares its features to existing implementations in other statistical software. By bringing robust methods to Python, RobPy enables more users to perform robust data analysis in a modern and versatile programming language.
Fast Linear Model Trees by PILOT
Feb 08, 2023Linear model trees are regression trees that incorporate linear models in the leaf nodes. This preserves the intuitive interpretation of decision trees and at the same time enables them to better capture linear relationships, which is hard for standard decision trees. But most existing methods for fitting linear model trees are time consuming and therefore not scalable to large data sets. In addition, they are more prone to overfitting and extrapolation issues than standard regression trees. In this paper we introduce PILOT, a new algorithm for linear model trees that is fast, regularized, stable and interpretable. PILOT trains in a greedy fashion like classic regression trees, but incorporates an $L^2$ boosting approach and a model selection rule for fitting linear models in the nodes. The abbreviation PILOT stands for $PI$ecewise $L$inear $O$rganic $T$ree, where `organic' refers to the fact that no pruning is carried out. PILOT has the same low time and space complexity as CART without its pruning. An empirical study indicates that PILOT tends to outperform standard decision trees and other linear model trees on a variety of data sets. Moreover, we prove its consistency in an additive model setting under weak assumptions. When the data is generated by a linear model, the convergence rate is polynomial.
The Cellwise Minimum Covariance Determinant Estimator
Jul 27, 2022
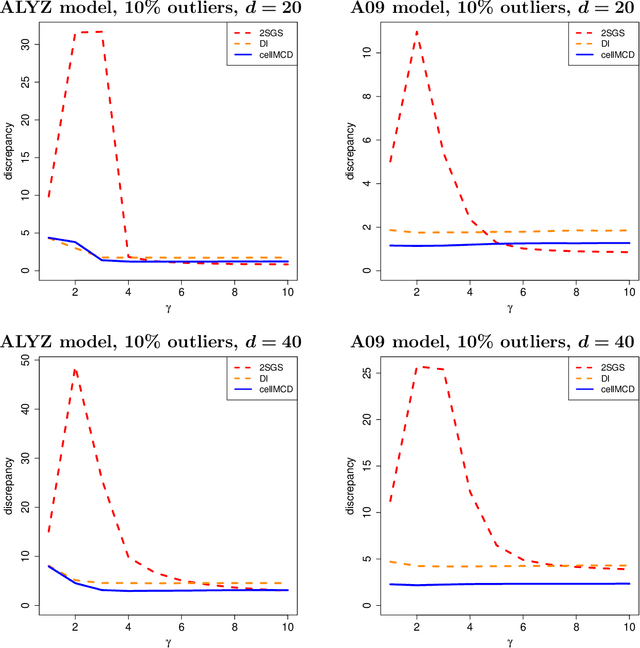
The usual Minimum Covariance Determinant (MCD) estimator of a covariance matrix is robust against casewise outliers. These are cases (that is, rows of the data matrix) that behave differently from the majority of cases, raising suspicion that they might belong to a different population. On the other hand, cellwise outliers are individual cells in the data matrix. When a row contains one or more outlying cells, the other cells in the same row still contain useful information that we wish to preserve. We propose a cellwise robust version of the MCD method, called cellMCD. Its main building blocks are observed likelihood and a sparsity penalty on the number of flagged cellwise outliers. It possesses good breakdown properties. We construct a fast algorithm for cellMCD based on concentration steps (C-steps) that always lower the objective. The method performs well in simulations with cellwise outliers, and has high finite-sample efficiency on clean data. It is illustrated on real data with visualizations of the results.
Silhouettes and quasi residual plots for neural nets and tree-based classifiers
Jun 16, 2021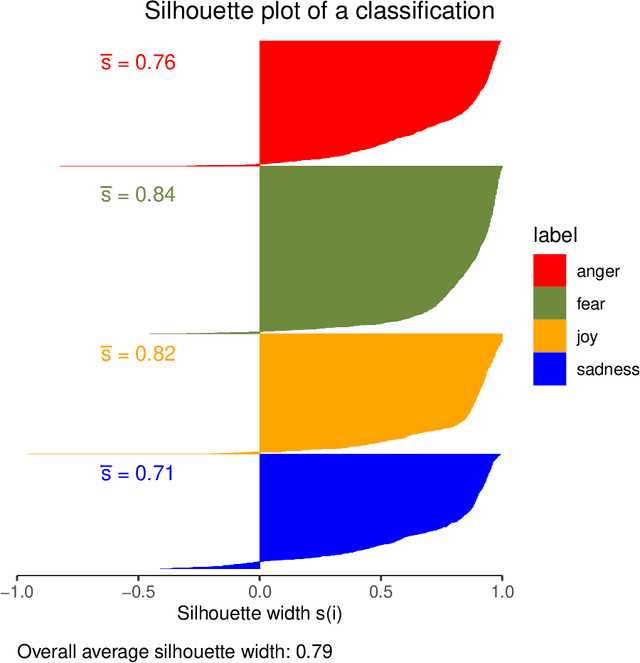
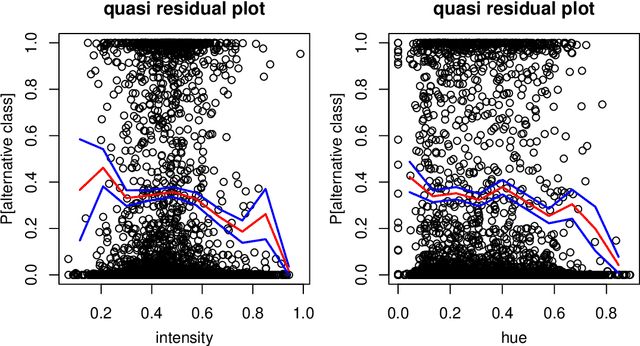
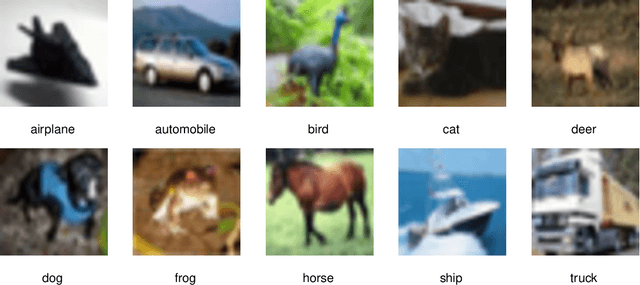
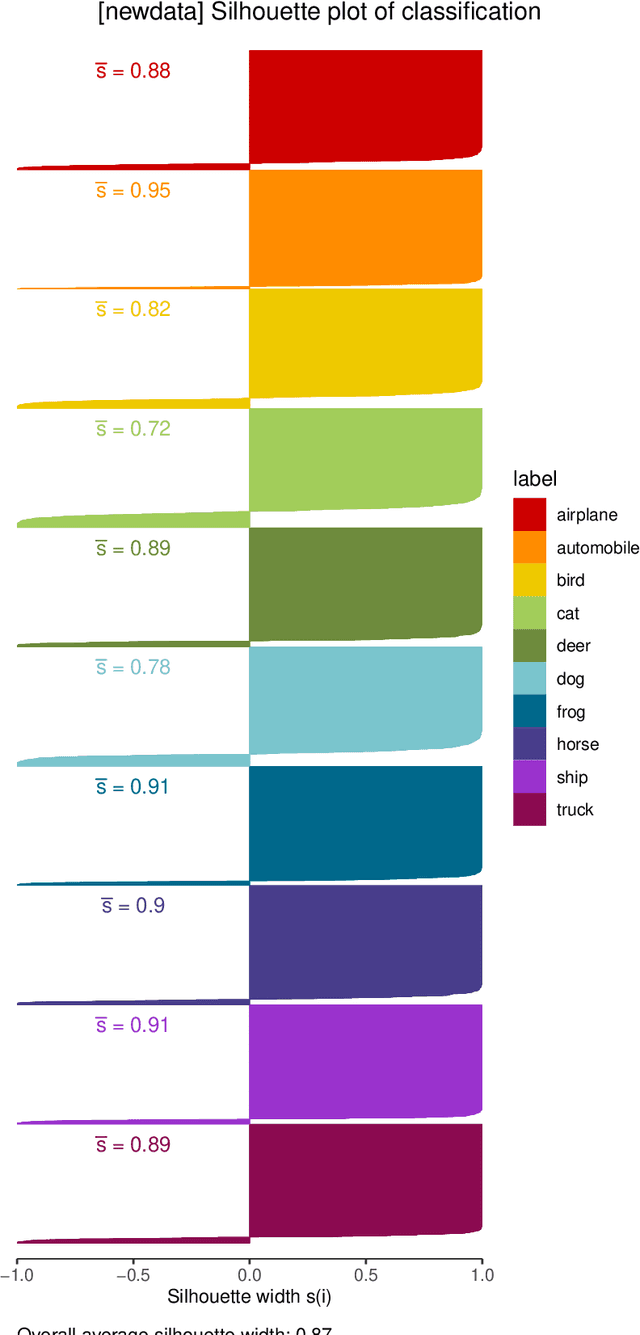
Classification by neural nets and by tree-based methods are powerful tools of machine learning. There exist interesting visualizations of the inner workings of these and other classifiers. Here we pursue a different goal, which is to visualize the cases being classified, either in training data or in test data. An important aspect is whether a case has been classified to its given class (label) or whether the classifier wants to assign it to different class. This is reflected in the (conditional and posterior) probability of the alternative class (PAC). A high PAC indicates label bias, i.e. the possibility that the case was mislabeled. The PAC is used to construct a silhouette plot which is similar in spirit to the silhouette plot for cluster analysis (Rousseeuw, 1987). The average silhouette width can be used to compare different classifications of the same dataset. We will also draw quasi residual plots of the PAC versus a data feature, which may lead to more insight in the data. One of these data features is how far each case lies from its given class. The graphical displays are illustrated and interpreted on benchmark data sets containing images, mixed features, and tweets.
Fast and Eager k-Medoids Clustering: O Runtime Improvement of the PAM, CLARA, and CLARANS Algorithms
Aug 12, 2020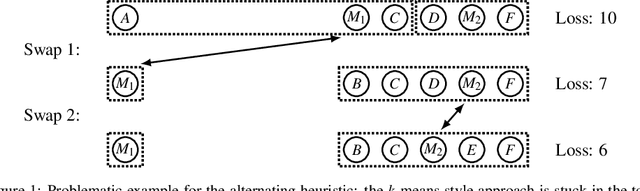
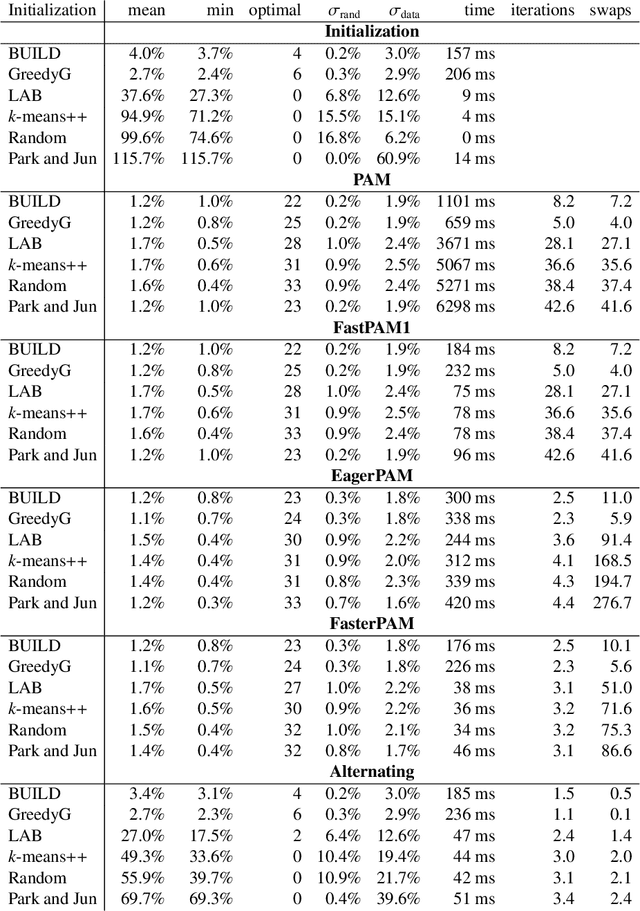
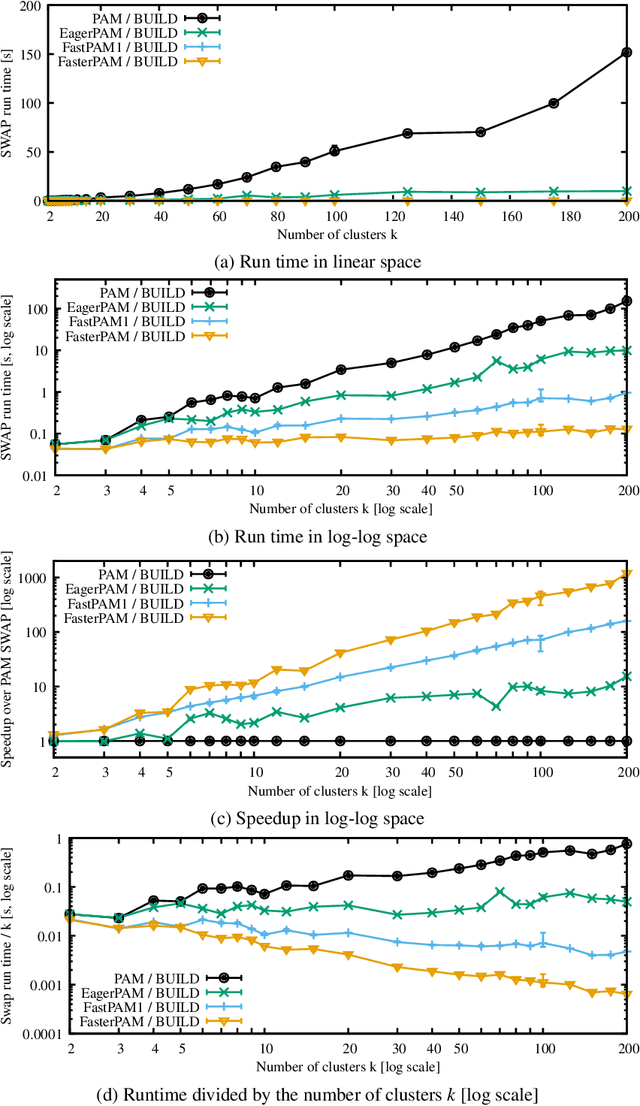
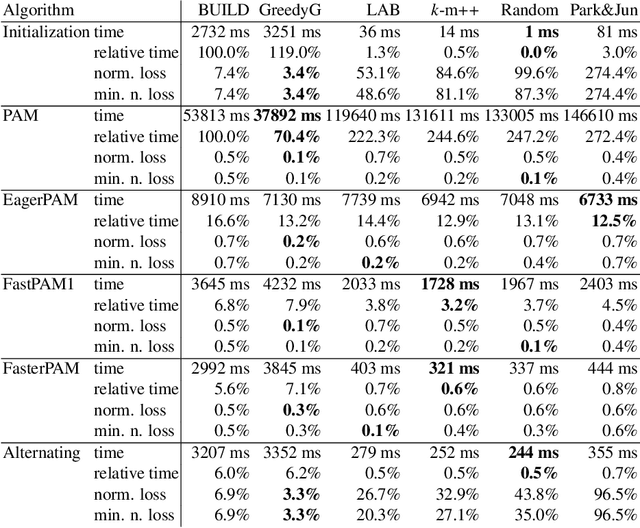
Clustering non-Euclidean data is difficult, and one of the most used algorithms besides hierarchical clustering is the popular algorithm Partitioning Around Medoids (PAM), also simply referred to as k-medoids clustering. In Euclidean geometry the mean-as used in k-means-is a good estimator for the cluster center, but this does not exist for arbitrary dissimilarities. PAM uses the medoid instead, the object with the smallest dissimilarity to all others in the cluster. This notion of centrality can be used with any (dis-)similarity, and thus is of high relevance to many domains and applications. A key issue with PAM is its high run time cost. We propose modifications to the PAM algorithm that achieve an O(k)-fold speedup in the second ("SWAP") phase of the algorithm, but will still find the same results as the original PAM algorithm. If we relax the choice of swaps performed (while retaining comparable quality), we can further accelerate the algorithm by eagerly performing additional swaps in each iteration. With the substantially faster SWAP, we can now explore faster initialization strategies, because (i) the classic ("BUILD") initialization now becomes the bottleneck, and (ii) our swap is fast enough to compensate for worse starting conditions. We also show how the CLARA and CLARANS algorithms benefit from the proposed modifications. While we do not study the parallelization of our approach in this work, it can easily be combined with earlier approaches to use PAM and CLARA on big data (some of which use PAM as a subroutine, hence can immediately benefit from these improvements), where the performance with high k becomes increasingly important. In experiments on real data with k=100,200, we observed a 458x respectively 1191x speedup compared to the original PAM SWAP algorithm, making PAM applicable to larger data sets, and in particular to higher k.
Outlier detection in non-elliptical data by kernel MRCD
Aug 05, 2020
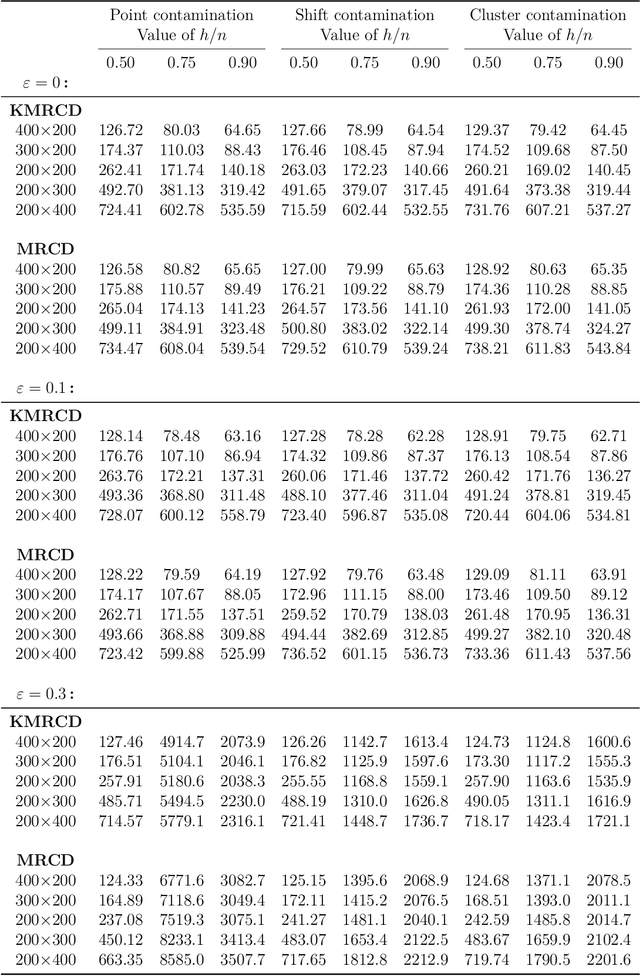
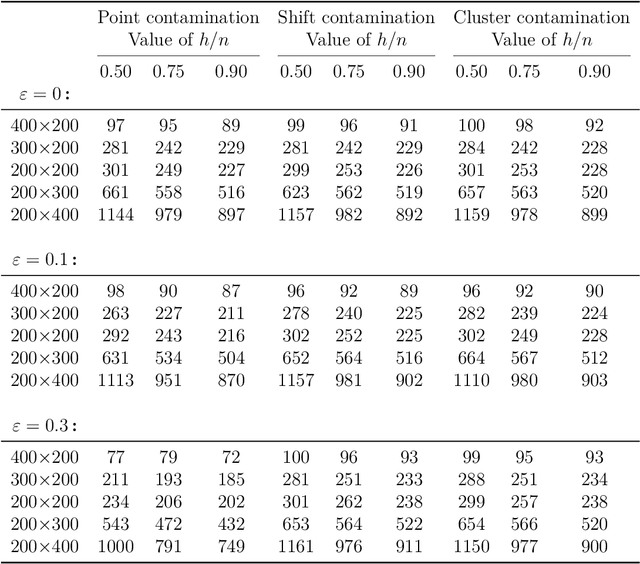
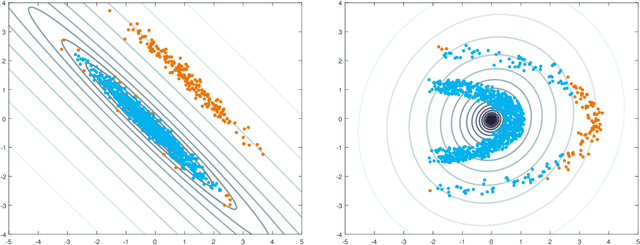
The minimum regularized covariance determinant method (MRCD) is a robust estimator for multivariate location and scatter, which detects outliers by fitting a robust covariance matrix to the data. Its regularization ensures that the covariance matrix is well-conditioned in any dimension. The MRCD assumes that the non-outlying observations are roughly elliptically distributed, but many datasets are not of that form. Moreover, the computation time of MRCD increases substantially when the number of variables goes up, and nowadays datasets with many variables are common. The proposed Kernel Minimum Regularized Covariance Determinant (KMRCD) estimator addresses both issues. It is not restricted to elliptical data because it implicitly computes the MRCD estimates in a kernel induced feature space. A fast algorithm is constructed that starts from kernel-based initial estimates and exploits the kernel trick to speed up the subsequent computations. Based on the KMRCD estimates, a rule is proposed to flag outliers. The KMRCD algorithm performs well in simulations, and is illustrated on real-life data.
Visualizing classification results
Jul 28, 2020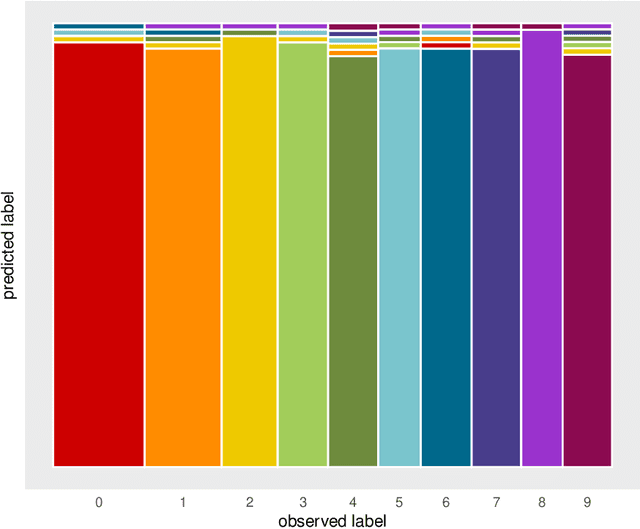
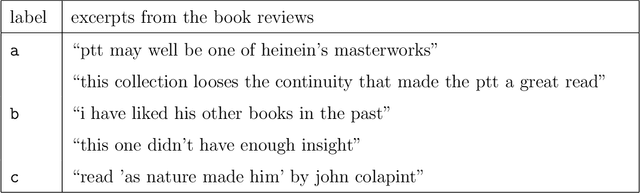
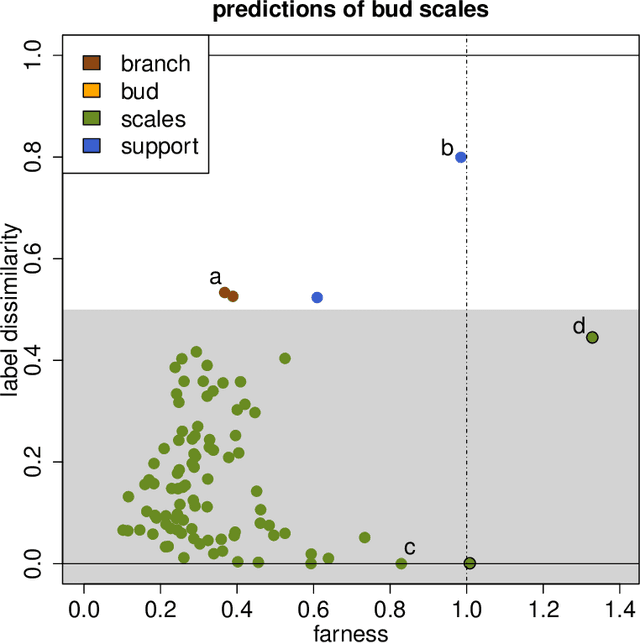
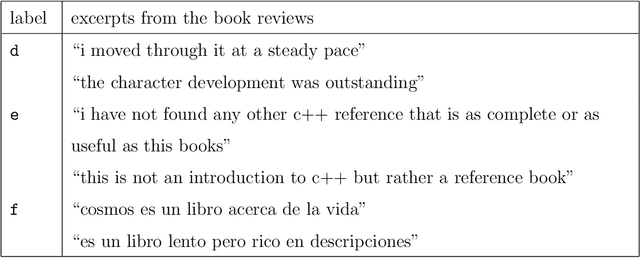
Classification is a major tool of statistics and machine learning. A classification method first processes a training set of objects with given classes (labels), with the goal of afterward assigning new objects to one of these classes. When running the resulting prediction method on the training data or on test data, it can happen that an object is predicted to lie in a class that differs from its given label. This is sometimes called label bias, and raises the question whether the object was mislabeled.Our goal is to visualize aspects of the data classification to obtain insight. The proposed display reflects to what extent each object's label is (dis)similar to its prediction, how far each object lies from the other objects in its class, and whether some objects lie far from all classes. The display is constructed for discriminant analysis, the k-nearest neighbor classifier, support vector machines, logistic regression, and majority voting. It is illustrated on several benchmark datasets containing images and texts.
Transforming variables to central normality
May 16, 2020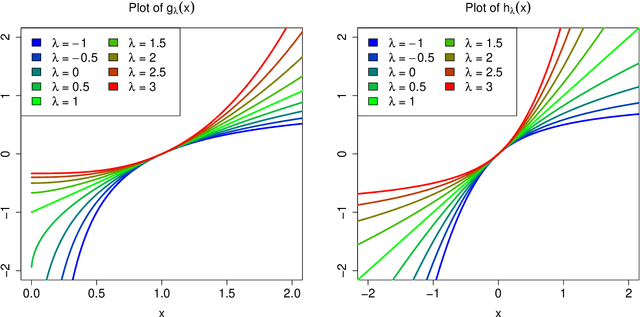
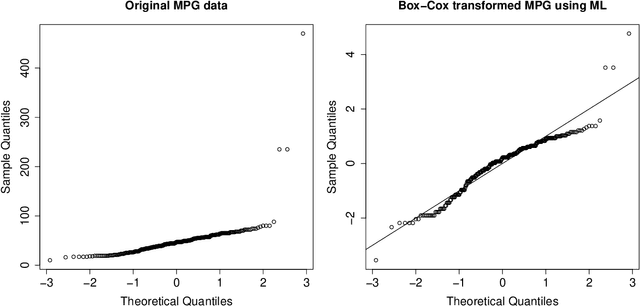
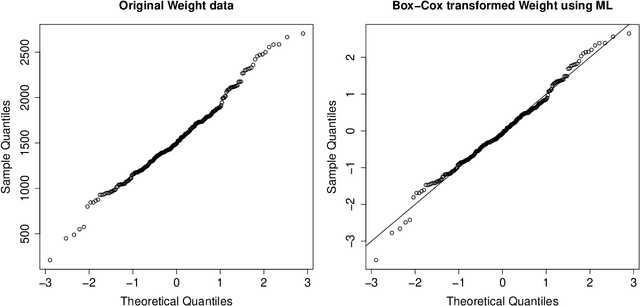

Many real data sets contain features (variables) whose distribution is far from normal (gaussian). Instead, their distribution is often skewed. In order to handle such data it is customary to preprocess the variables to make them more normal. The Box-Cox and Yeo-Johnson transformations are well-known tools for this. However, the standard maximum likelihood estimator of their transformation parameter is highly sensitive to outliers, and will often try to move outliers inward at the expense of the normality of the central part of the data. We propose an automatic preprocessing technique that is robust against such outliers, which transforms the data to central normality. It compares favorably to existing techniques in an extensive simulation study and on real data.