 Add to Chrome
 Add to Firefox
 Add to Edge
Anomaly Detection: Review and preliminary Entropy method tests
Aug 29, 2017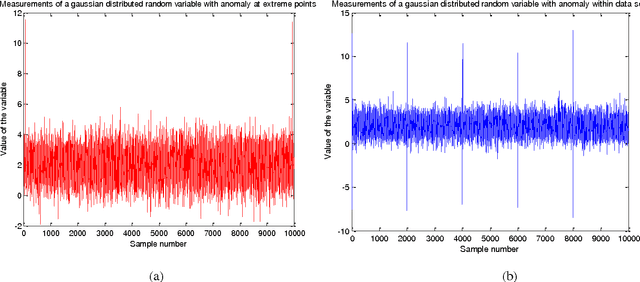
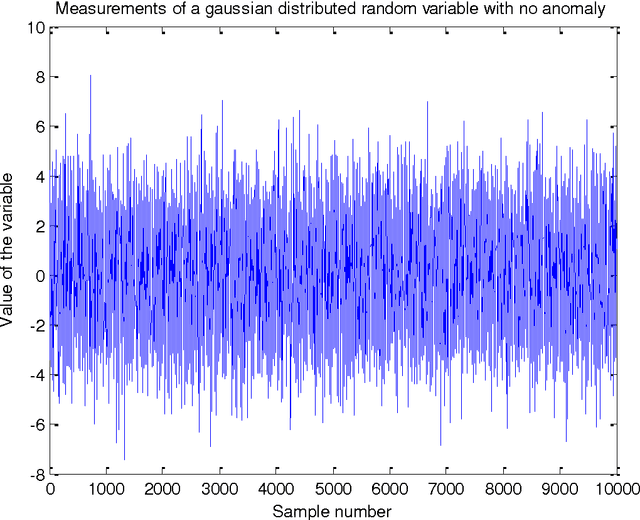
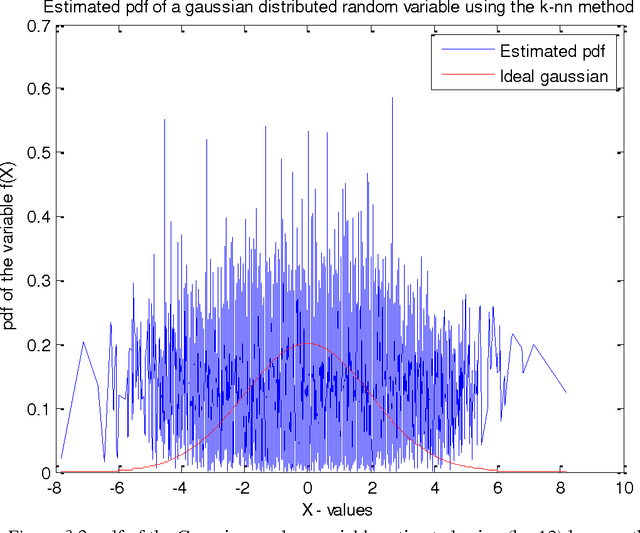
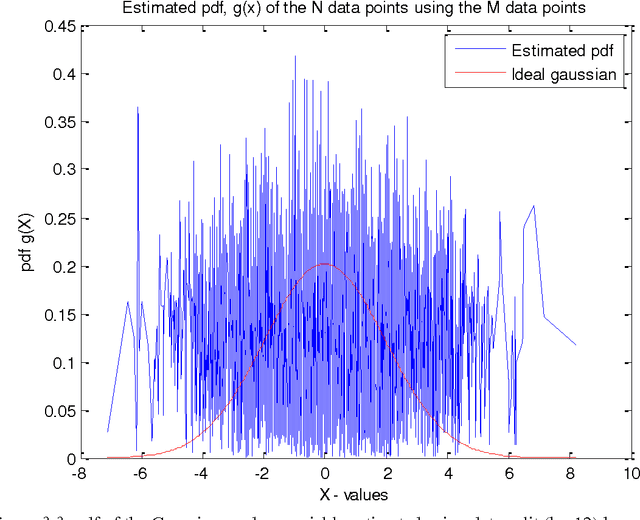
Anomalies are strange data points; they usually represent an unusual occurrence. Anomaly detection is presented from the perspective of Wireless sensor networks. Different approaches have been taken in the past, as we will see, not only to identify outliers, but also to establish the statistical properties of the different methods. The usual goal is to show that the approach is asymptotically efficient and that the metric used is unbiased or maybe biased. This project is based on a work done by [1]. The approach is based on the principle that the entropy of the data is increased when an anomalous data point is measured. The entropy of the data set is thus to be estimated. In this report however, preliminary efforts at confirming the results of [1] is presented. To estimate the entropy of the dataset, since no parametric form is assumed, the probability density function of the data set is first estimated using data split method. This estimated pdf value is then plugged-in to the entropy estimation formula to estimate the entropy of the dataset. The data (test signal) used in this report is Gaussian distributed with zero mean and variance 4. Results of pdf estimation using the k-nearest neighbour method using the entire dataset, and a data-split method are presented and compared based on how well they approximate the probability density function of a Gaussian with similar mean and variance. The number of nearest neighbours chosen for the purpose of this report is 8. This is arbitrary, but is reasonable since the number of anomalies introduced is expected to be less than this upon data-split. The data-split method is preferred and rightly so.
Anomaly Detection in Wireless Sensor Networks
Aug 27, 2017Wireless sensor networks usually comprise a large number of sensors monitoring changes in variables. These changes in variables represent changes in physical quantities. The changes can occur for various reasons; these reasons are highlighted in this work. Outliers are unusual measurements. Outliers are important; they are information-bearing occurrences. This work seeks to identify them based on an approach presented in [1]. A critical review of most previous works in this area has been presented in [2], and few more are considered here just to set the stage. The main work can be described as this; given a set of measurements from sensors that represent a normal situation, [1] proceeds by first estimating the probability density function (pdf) of the set using a data-split approach, then estimate the entropy of the set using the arithmetic mean as an approximation for the expectation. The increase in entropy that occurs when strange data is recorded is used to detect unusual measurements in the test set depending on the desired confidence interval or false alarm rate. The results presented in [1] have been confirmed for different test signals such as the Gaussian, Beta, in one dimension and beta in two dimensions, and a beta and uniform mixture distribution in two dimensions. Finally, the method was confirmed on real data and the results are presented. The major drawbacks of [1] were identified, and a method that seeks to mitigate this using the Bhattacharyya distance is presented. This method detects more subtle anomalies, especially the type that would pass as normal in [1]. Finally, recommendations for future research are presented: the subject of interpretability, especially for subtle measurements, being the most elusive as of today.