 Add to Chrome
 Add to Firefox
 Add to Edge
From Surface Forecasting to Observability Forecasting: A Latent World Model for Cloud-Aware EO Monitoring
Jul 15, 2026
The bottleneck of Earth Observation processing chains is not the arrival of new imagery but whether the surface is actually visible when the image arrives. We study this as an observability forecasting problem on EarthNet2021. Given recent multispectral imagery and exogenous weather drivers, the goal is to predict whether the next acquisition will be usable and, if not, when a usable view is likely to return. To do this, we adapt LeWorldModel, a joint-embedding predictive architecture world model, to cloud-aware Earth Observation sequences. The final pipeline converts raw minicubes into episodic HDF5 sequences with five image channels (blue, green, red, near-infrared, cloud mask) and eight meteorological and calendar covariates. The resulting model has 18.0M trainable parameters and is trained from scratch on 23,904 training episodes. The trained leWorldModel is evaluated under a locked protocol: linear probes are fit on train only, calibration choices are set on an internal validation split, and the fitted heads are then frozen for valsplit, IID, OOD, and extreme evaluation. On the full frozen-bundle observability benchmark, LeWorldModel consistently outperforms persistence. For next-step usability, balanced accuracy ranges from 0.769 to 0.887, compared with 0.493 to 0.556 for persistence. For exact first-usable-horizon prediction, accuracy ranges from 0.602 to 0.806, compared with 0.120 to 0.369 for persistence. Against a frozen LightGBM baseline fit on the same training windows, LeWorldModel is better on continuous clear/cloud regression and on exact recovery timing on valsplit, IID, and extreme, while LightGBM is stronger on the simpler binary any-usable-within-six task and is more robust on OOD. In separate sampled diagnostic analyses, LeWM also produces strong ranking-based anomaly signals under synthetic temporal inconsistencies.

Reconstruction of Sentinel-2 Time Series Using Robust Gaussian Mixture Models -- Application to the Detection of Anomalous Crop Development in wheat and rapeseed crops
Oct 22, 2021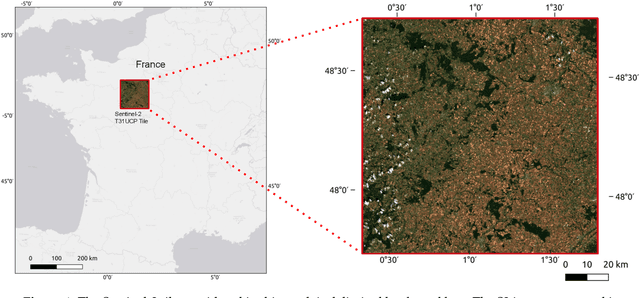
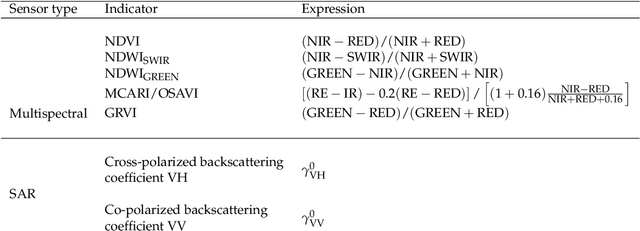
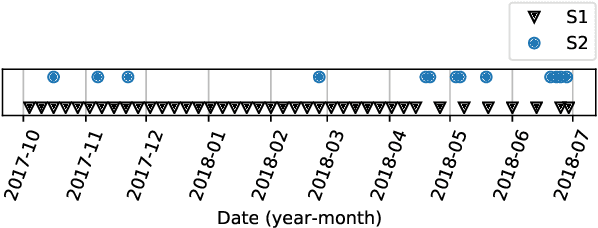
Missing data is a recurrent problem in remote sensing, mainly due to cloud coverage for multispectral images and acquisition problems. This can be a critical issue for crop monitoring, especially for applications relying on machine learning techniques, which generally assume that the feature matrix does not have missing values. This paper proposes a Gaussian Mixture Model (GMM) for the reconstruction of parcel-level features extracted from multispectral images. A robust version of the GMM is also investigated, since datasets can be contaminated by inaccurate samples or features (e.g., wrong crop type reported, inaccurate boundaries, undetected clouds, etc). Additional features extracted from Synthetic Aperture Radar (SAR) images using Sentinel-1 data are also used to provide complementary information and improve the imputations. The robust GMM investigated in this work assigns reduced weights to the outliers during the estimation of the GMM parameters, which improves the final reconstruction. These weights are computed at each step of an Expectation-Maximization (EM) algorithm by using outlier scores provided by the isolation forest algorithm. Experimental validation is conducted on rapeseed and wheat parcels located in the Beauce region (France). Overall, we show that the GMM imputation method outperforms other reconstruction strategies. A mean absolute error (MAE) of 0.013 (resp. 0.019) is obtained for the imputation of the median Normalized Difference Index (NDVI) of the rapeseed (resp. wheat) parcels. Other indicators (e.g., Normalized Difference Water Index) and statistics (for instance the interquartile range, which captures heterogeneity among the parcel indicator) are reconstructed at the same time with good accuracy. In a dataset contaminated by irrelevant samples, using the robust GMM is recommended since the standard GMM imputation can lead to inaccurate imputed values.
Unsupervised crop anomaly detection at the parcel-level using optical and SAR images: application to wheat and rapeseed crops
Apr 17, 2020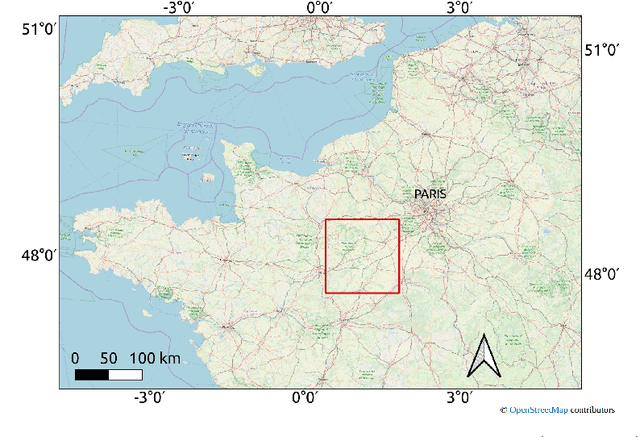
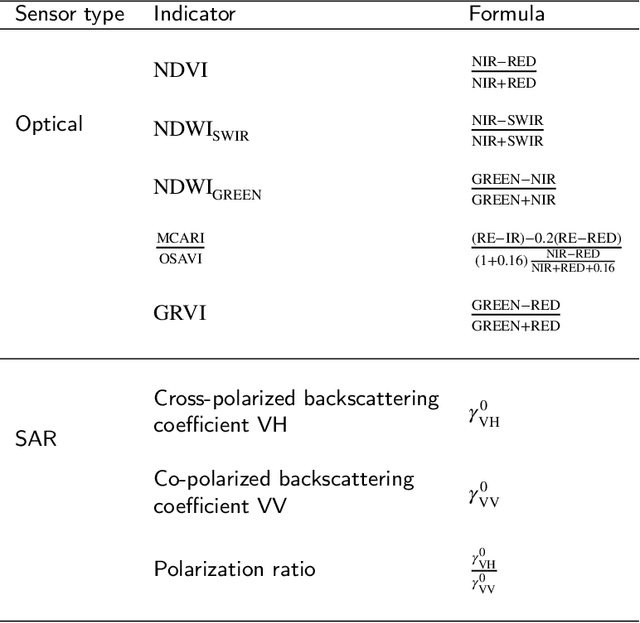
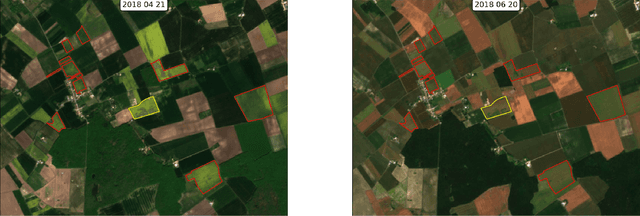
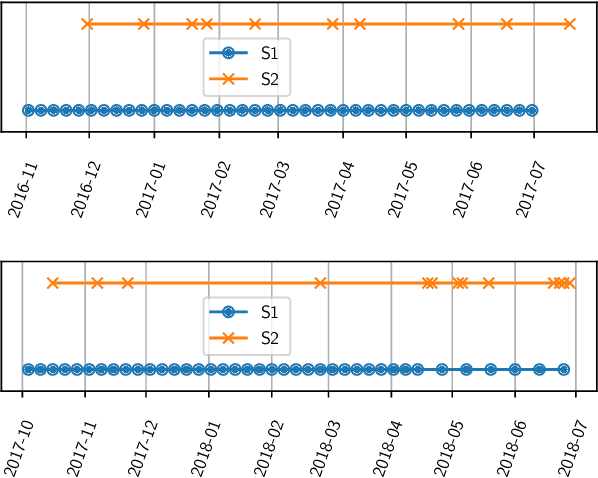
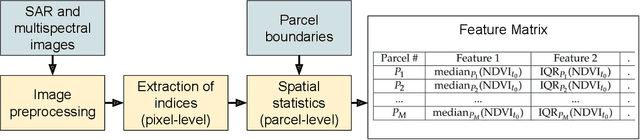
This paper proposes a generic approach for crop anomaly detection at the parcel-level based on unsupervised point anomaly detection techniques. The input data is derived from synthetic aperture radar (SAR) and optical images acquired using Sentinel-1 and Sentinel-2 satellites. The proposed strategy consists of four sequential steps: acquisition and preprocessing of optical and SAR images, extraction of optical and SAR indicators, computation of zonal statistics at the parcel-level and point anomaly detection. This paper analyzes different factors that can affect the results of anomaly detection such as the considered features and the anomaly detection algorithm used. The proposed procedure is validated on two crop types in Beauce (France), namely, rapeseed and wheat crops. Two different parcel delineation databases are considered to validate the robustness of the strategy to changes in parcel boundaries.