 Add to Chrome
 Add to Firefox
 Add to Edge
Beyond Defensive Reporting: Machine Learning for Active Anti-Money Laundering Control in Insurance
Jun 15, 2026Money laundering through insurance claims poses a threat to insurers both through fraudulent payouts and reputational and regulatory risk. Despite this, little research has examined how such laundering can be prevented. This paper examines whether machine learning can help insurers flag suspicious claims before payout, shifting the focus from passive reporting to active prevention. Using production data from a major Norwegian insurer, we train gradient-boosted decision tree models to detect claims later reported to authorities for suspected money laundering. Because fraud and laundering may share behavioural patterns, we also examine whether insurance fraud labels can serve as an auxiliary training signal. We compare different learning setups using the Budget-Weighted Capture Rate, a metric introduced in this paper to measure how many laundering cases are captured when only a small share of claims can be manually reviewed. The results show that incorporating fraud-related investigation labels substantially improves laundering detection. The best-performing model captures nearly two-thirds of laundering cases within the top-ranked 2 to 6 percent of claims selected for investigation. To our knowledge, this is the first empirical study of machine learning for money laundering detection in insurance claims.
How important are the genes to explain the outcome - the asymmetric Shapley value as an honest importance metric for high-dimensional features
Mar 05, 2026In clinical prediction settings the importance of a high-dimensional feature like genomics is often assessed by evaluating the change in predictive performance when adding it to a set of traditional clinical variables. This approach is questionable, because it does not account for collinearity nor known directionality of dependencies between variables. We suggest to use asymmetric Shapley values as a more suitable alternative to quantify feature importance in the context of a mixed-dimensional prediction model. We focus on a setting that is particularly relevant in clinical prediction: disease state as a mediating variable for genomic effects, with additional confounders for which the direction of effects may be unknown. We derive efficient algorithms to compute local and global asymmetric Shapley values for this setting. The former are shown to be very useful for inference, whereas the latter provide interpretation by decomposing any predictive performance metric into contributions of the features. Throughout, we illustrate our framework by a leading example: the prediction of progression-free survival for colorectal cancer patients.
What's Wrong with Your Synthetic Tabular Data? Using Explainable AI to Evaluate Generative Models
Apr 29, 2025Evaluating synthetic tabular data is challenging, since they can differ from the real data in so many ways. There exist numerous metrics of synthetic data quality, ranging from statistical distances to predictive performance, often providing conflicting results. Moreover, they fail to explain or pinpoint the specific weaknesses in the synthetic data. To address this, we apply explainable AI (XAI) techniques to a binary detection classifier trained to distinguish real from synthetic data. While the classifier identifies distributional differences, XAI concepts such as feature importance and feature effects, analyzed through methods like permutation feature importance, partial dependence plots, Shapley values and counterfactual explanations, reveal why synthetic data are distinguishable, highlighting inconsistencies, unrealistic dependencies, or missing patterns. This interpretability increases transparency in synthetic data evaluation and provides deeper insights beyond conventional metrics, helping diagnose and improve synthetic data quality. We apply our approach to two tabular datasets and generative models, showing that it uncovers issues overlooked by standard evaluation techniques.
shapr: Explaining Machine Learning Models with Conditional Shapley Values in R and Python
Apr 02, 2025This paper introduces the shapr package, a versatile tool for generating Shapley value explanations for machine learning and statistical regression models in both R and Python. The package emphasizes conditional Shapley value estimates, providing a comprehensive range of approaches for accurately capturing feature dependencies, which is crucial for correct model interpretation and lacking in similar software. In addition to regular tabular data, the shapr R-package includes specialized functionality for explaining time series forecasts. The package offers a minimal set of user functions with sensible defaults for most use cases while providing extensive flexibility for advanced users to fine-tune computations. Additional features include parallelized computations, iterative estimation with convergence detection, and rich visualization tools. shapr also extends its functionality to compute causal and asymmetric Shapley values when causal information is available. In addition, we introduce the shaprpy Python library, which brings core capabilities of shapr to the Python ecosystem. Overall, the package aims to enhance the interpretability of predictive models within a powerful and user-friendly framework.
Improving the Sampling Strategy in KernelSHAP
Oct 07, 2024Shapley values are a popular model-agnostic explanation framework for explaining predictions made by complex machine learning models. The framework provides feature contribution scores that sum to the predicted response and represent each feature's importance. The computation of exact Shapley values is computationally expensive due to estimating an exponential amount of non-trivial conditional expectations. The KernelSHAP framework enables us to approximate the Shapley values using a sampled subset of weighted conditional expectations. We propose three main novel contributions: a stabilizing technique to reduce the variance of the weights in the current state-of-the-art strategy, a novel weighing scheme that corrects the Shapley kernel weights based on sampled subsets, and a straightforward strategy that includes the important subsets and integrates them with the corrected Shapley kernel weights. We compare these new approximation strategies against existing ones by evaluating their Shapley value accuracy as a function of the number of subsets. The results demonstrate that our sampling strategies significantly enhance the accuracy of the approximated Shapley value explanations, making them more reliable in practical applications. This work provides valuable insights and practical recommendations for researchers and practitioners seeking to implement Shapley value-based explainability of their models.
Finding Money Launderers Using Heterogeneous Graph Neural Networks
Jul 25, 2023


Current anti-money laundering (AML) systems, predominantly rule-based, exhibit notable shortcomings in efficiently and precisely detecting instances of money laundering. As a result, there has been a recent surge toward exploring alternative approaches, particularly those utilizing machine learning. Since criminals often collaborate in their money laundering endeavors, accounting for diverse types of customer relations and links becomes crucial. In line with this, the present paper introduces a graph neural network (GNN) approach to identify money laundering activities within a large heterogeneous network constructed from real-world bank transactions and business role data belonging to DNB, Norway's largest bank. Specifically, we extend the homogeneous GNN method known as the Message Passing Neural Network (MPNN) to operate effectively on a heterogeneous graph. As part of this procedure, we propose a novel method for aggregating messages across different edges of the graph. Our findings highlight the importance of using an appropriate GNN architecture when combining information in heterogeneous graphs. The performance results of our model demonstrate great potential in enhancing the quality of electronic surveillance systems employed by banks to detect instances of money laundering. To the best of our knowledge, this is the first published work applying GNN on a large real-world heterogeneous network for anti-money laundering purposes.
A Comparative Study of Methods for Estimating Conditional Shapley Values and When to Use Them
May 16, 2023Shapley values originated in cooperative game theory but are extensively used today as a model-agnostic explanation framework to explain predictions made by complex machine learning models in the industry and academia. There are several algorithmic approaches for computing different versions of Shapley value explanations. Here, we focus on conditional Shapley values for predictive models fitted to tabular data. Estimating precise conditional Shapley values is difficult as they require the estimation of non-trivial conditional expectations. In this article, we develop new methods, extend earlier proposed approaches, and systematize the new refined and existing methods into different method classes for comparison and evaluation. The method classes use either Monte Carlo integration or regression to model the conditional expectations. We conduct extensive simulation studies to evaluate how precisely the different method classes estimate the conditional expectations, and thereby the conditional Shapley values, for different setups. We also apply the methods to several real-world data experiments and provide recommendations for when to use the different method classes and approaches. Roughly speaking, we recommend using parametric methods when we can specify the data distribution almost correctly, as they generally produce the most accurate Shapley value explanations. When the distribution is unknown, both generative methods and regression models with a similar form as the underlying predictive model are good and stable options. Regression-based methods are often slow to train but produce the Shapley value explanations quickly once trained. The vice versa is true for Monte Carlo-based methods, making the different methods appropriate in different practical situations.
Using Shapley Values and Variational Autoencoders to Explain Predictive Models with Dependent Mixed Features
Nov 26, 2021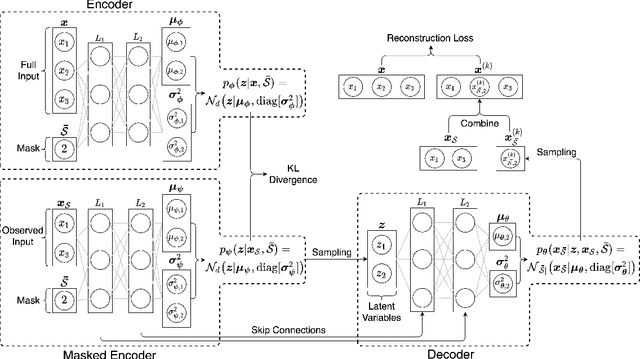
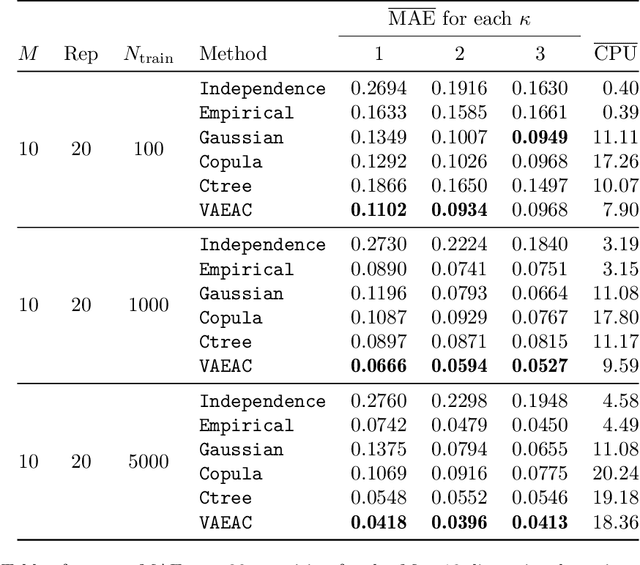
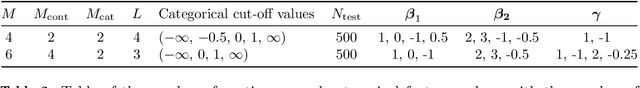
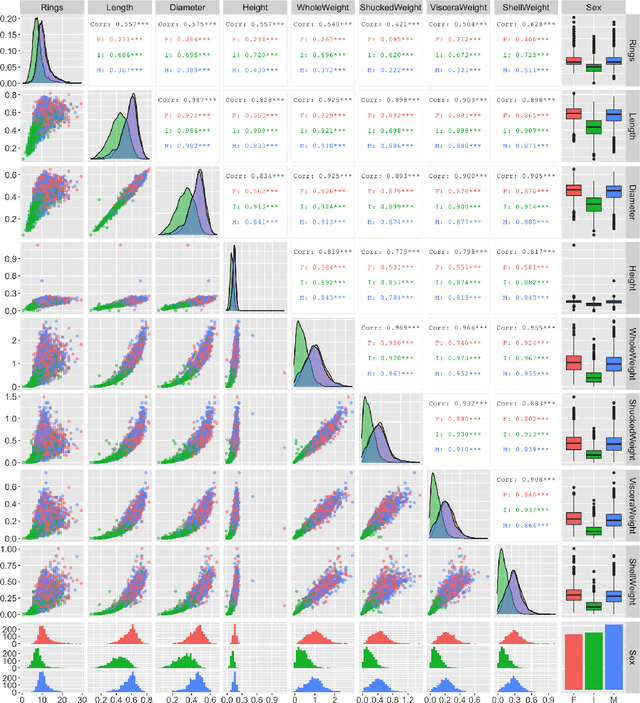
Shapley values are today extensively used as a model-agnostic explanation framework to explain complex predictive machine learning models. Shapley values have desirable theoretical properties and a sound mathematical foundation. Precise Shapley value estimates for dependent data rely on accurate modeling of the dependencies between all feature combinations. In this paper, we use a variational autoencoder with arbitrary conditioning (VAEAC) to model all feature dependencies simultaneously. We demonstrate through comprehensive simulation studies that VAEAC outperforms the state-of-the-art methods for a wide range of settings for both continuous and mixed dependent features. Finally, we apply VAEAC to the Abalone data set from the UCI Machine Learning Repository.
MCCE: Monte Carlo sampling of realistic counterfactual explanations
Nov 18, 2021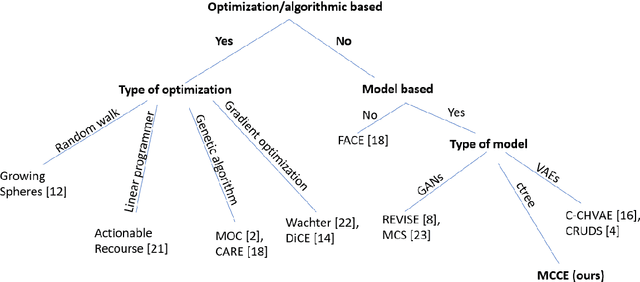
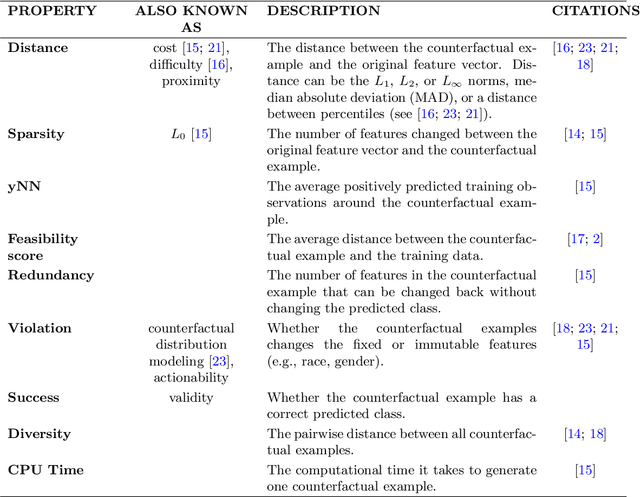
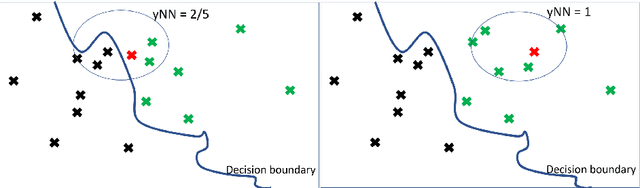
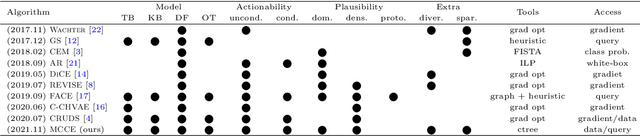
In this paper we introduce MCCE: Monte Carlo sampling of realistic Counterfactual Explanations, a model-based method that generates counterfactual explanations by producing a set of feasible examples using conditional inference trees. Unlike algorithmic-based counterfactual methods that have to solve complex optimization problems or other model based methods that model the data distribution using heavy machine learning models, MCCE is made up of only two light-weight steps (generation and post-processing). MCCE is also straightforward for the end user to understand and implement, handles any type of predictive model and type of feature, takes into account actionability constraints when generating the counterfactual explanations, and generates as many counterfactual explanations as needed. In this paper we introduce MCCE and give a comprehensive list of performance metrics that can be used to compare counterfactual explanations. We also compare MCCE with a range of state-of-the-art methods and a new baseline method on benchmark data sets. MCCE outperforms all model-based methods and most algorithmic-based methods when also taking into account validity (i.e., a correctly changed prediction) and actionability constraints. Finally, we show that MCCE has the strength of performing almost as well when given just a small subset of the training data.
groupShapley: Efficient prediction explanation with Shapley values for feature groups
Jun 23, 2021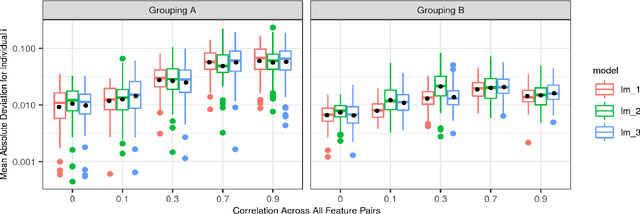
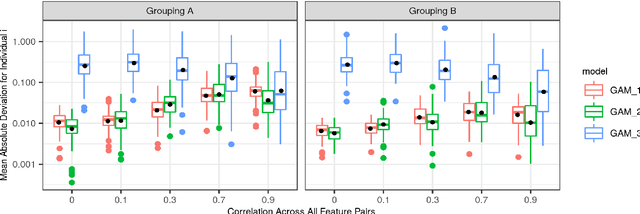
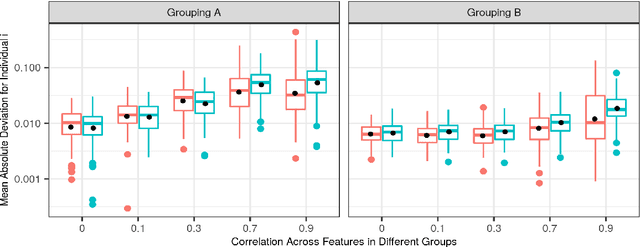
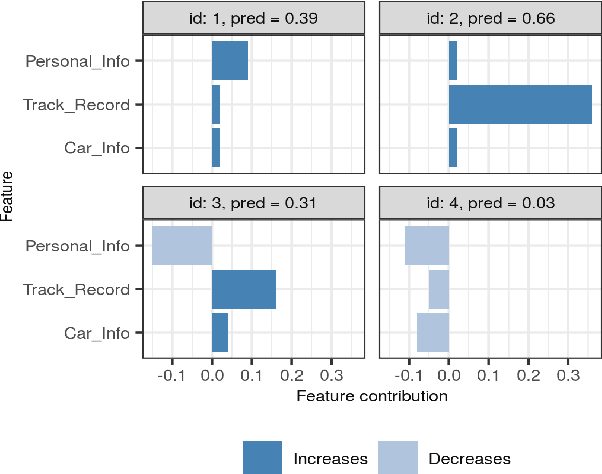
Shapley values has established itself as one of the most appropriate and theoretically sound frameworks for explaining predictions from complex machine learning models. The popularity of Shapley values in the explanation setting is probably due to its unique theoretical properties. The main drawback with Shapley values, however, is that its computational complexity grows exponentially in the number of input features, making it unfeasible in many real world situations where there could be hundreds or thousands of features. Furthermore, with many (dependent) features, presenting/visualizing and interpreting the computed Shapley values also becomes challenging. The present paper introduces groupShapley: a conceptually simple approach for dealing with the aforementioned bottlenecks. The idea is to group the features, for example by type or dependence, and then compute and present Shapley values for these groups instead of for all individual features. Reducing hundreds or thousands of features to half a dozen or so, makes precise computations practically feasible and the presentation and knowledge extraction greatly simplified. We prove that under certain conditions, groupShapley is equivalent to summing the feature-wise Shapley values within each feature group. Moreover, we provide a simulation study exemplifying the differences when these conditions are not met. We illustrate the usability of the approach in a real world car insurance example, where groupShapley is used to provide simple and intuitive explanations.