 Add to Chrome
 Add to Firefox
 Add to Edge
Automated Explanation Selection for Scientific Discovery
Jul 24, 2024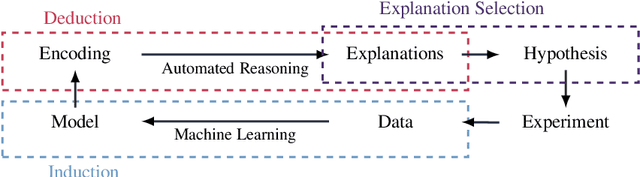
Automated reasoning is a key technology in the young but rapidly growing field of Explainable Artificial Intelligence (XAI). Explanability helps build trust in artificial intelligence systems beyond their mere predictive accuracy and robustness. In this paper, we propose a cycle of scientific discovery that combines machine learning with automated reasoning for the generation and the selection of explanations. We present a taxonomy of explanation selection problems that draws on insights from sociology and cognitive science. These selection criteria subsume existing notions and extend them with new properties.
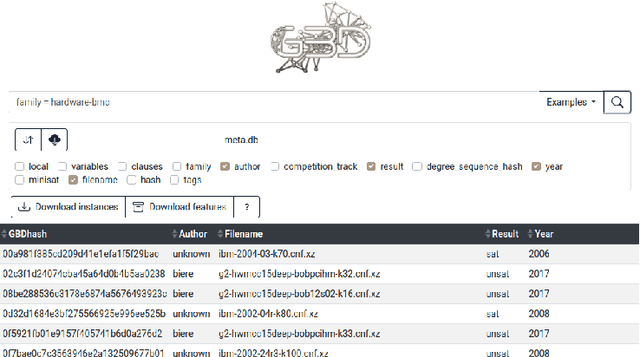
Global Benchmark Database
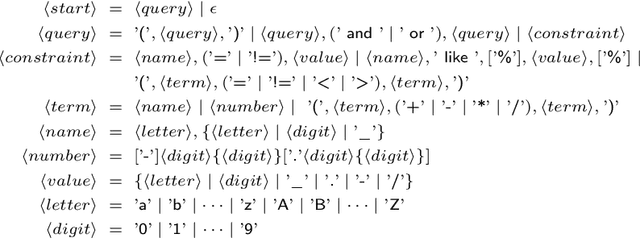
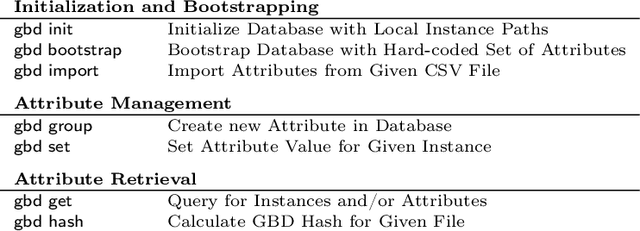
May 16, 2024This paper presents Global Benchmark Database (GBD), a comprehensive suite of tools for provisioning and sustainably maintaining benchmark instances and their metadata. The availability of benchmark metadata is essential for many tasks in empirical research, e.g., for the data-driven compilation of benchmarks, the domain-specific analysis of runtime experiments, or the instance-specific selection of solvers. In this paper, we introduce the data model of GBD as well as its interfaces and provide examples of how to interact with them. We also demonstrate the integration of custom data sources and explain how to extend GBD with additional problem domains, instance formats and feature extractors.
SATViz: Real-Time Visualization of Clausal Proofs
Sep 13, 2022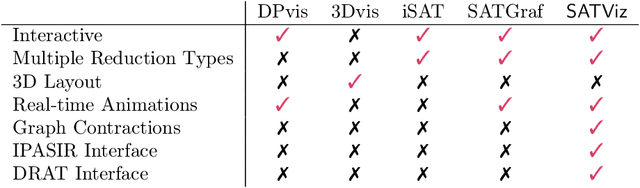
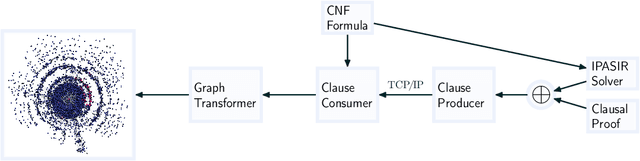
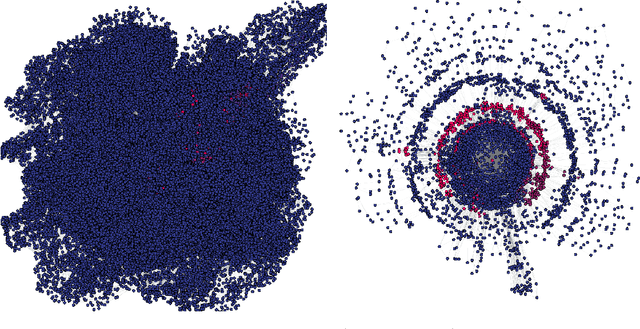
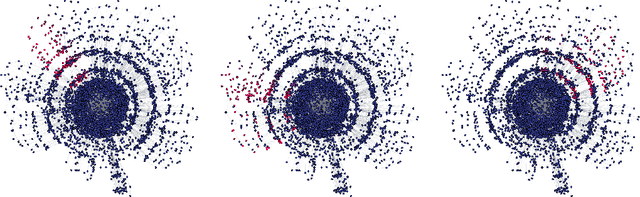
Visual layouts of graphs representing SAT instances can highlight the community structure of SAT instances. The community structure of SAT instances has been associated with both instance hardness and known clause quality heuristics. Our tool SATViz visualizes CNF formulas using the variable interaction graph and a force-directed layout algorithm. With SATViz, clause proofs can be animated to continuously highlight variables that occur in a moving window of recently learned clauses. If needed, SATViz can also create new layouts of the variable interaction graph with the adjusted edge weights. In this paper, we describe the structure and feature set of SATViz. We also present some interesting visualizations created with SATViz.
Collaborative Management of Benchmark Instances and their Attributes
Sep 07, 2020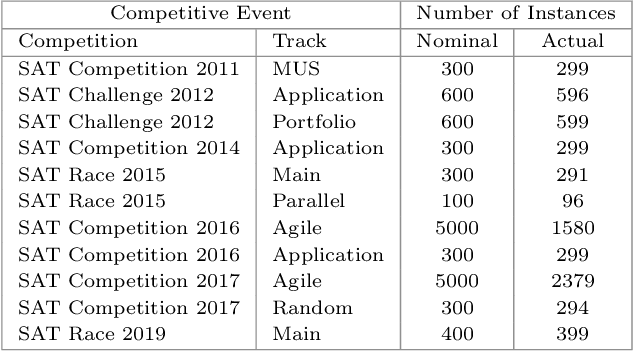
Experimental evaluation is an integral part in the design process of algorithms. Publicly available benchmark instances are widely used to evaluate methods in SAT solving. For the interpretation of results and the design of algorithm portfolios their attributes are crucial. Capturing the interrelation of benchmark instances and their attributes is considerably simplified through our specification of a benchmark instance identifier. Thus, our tool increases the availability of both by providing means to manage and retrieve benchmark instances by their attributes and vice versa. Like this, it facilitates the design and analysis of SAT experiments and the exchange of results.