 Add to Chrome
 Add to Firefox
 Add to Edge
Unique Metric for Health Analysis with Optimization of Clustering Activity and Cross Comparison of Results from Different Approach
Oct 08, 2018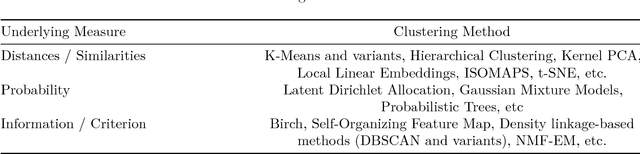
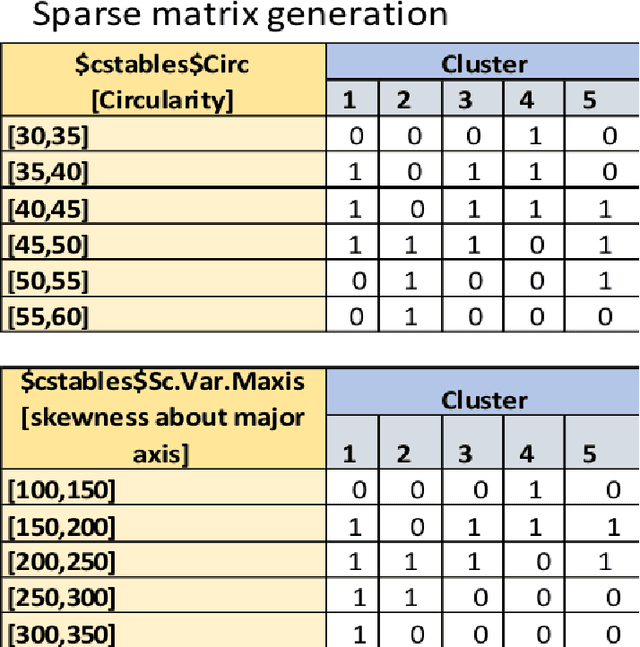
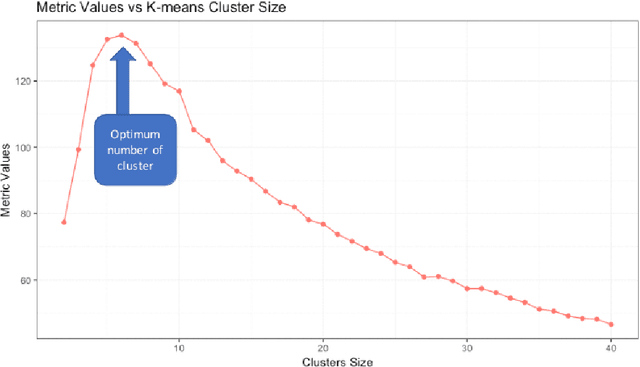
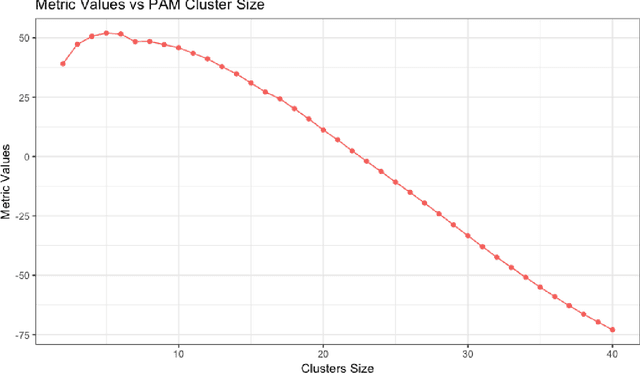
In machine learning and data mining, Cluster analysis is one of the most widely used unsupervised learning technique. Philosophy of this algorithm is to find similar data items and group them together based on any distance function in multidimensional space. These methods are suitable for finding groups of data that behave in a coherent fashion. The perspective may vary for clustering i.e. the way we want to find similarity, some methods are based on distance such as K-Means technique and some are probability based, like GMM. Understanding prominent segment of data is always challenging as multidimension space does not allow us to have a look and feel of the distance or any visual context on the health of the clustering. While explaining data using clusters, the major problem is to tell how many cluster are good enough to explain the data. Generally basic descriptive statistics are used to estimate cluster behaviour like scree plot, dendrogram etc. We propose a novel method to understand the cluster behaviour which can be used not only to find right number of clusters but can also be used to access the difference of health between different clustering methods on same data. Our technique would also help to also eliminate the noisy variables and optimize the clustering result. keywords - Clustering, Metric, K-means, hierarchical clustering, silhoutte, clustering index, measures
Reinforcement Evolutionary Learning Method for self-learning
Oct 07, 2018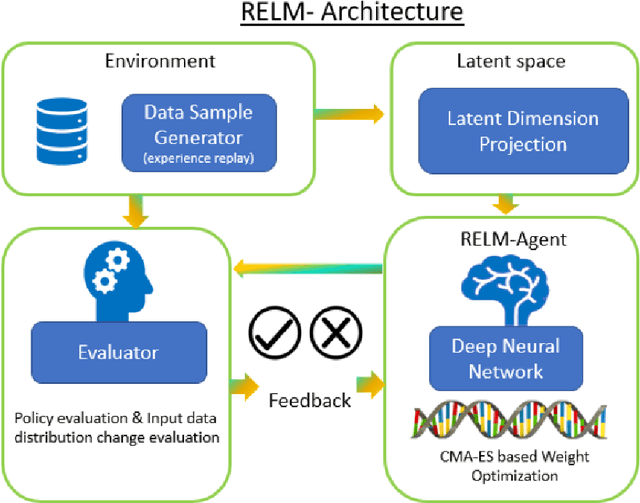
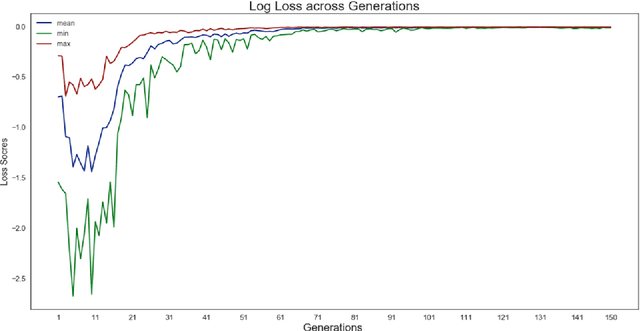
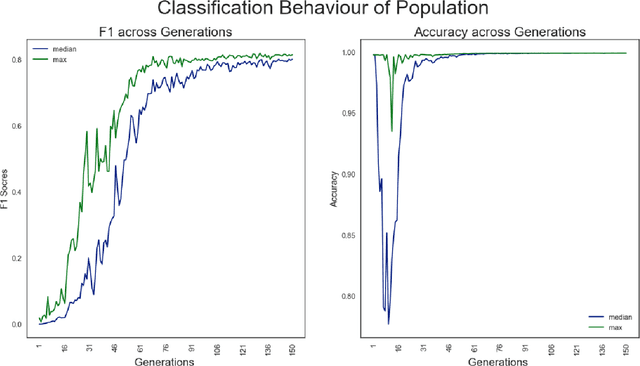
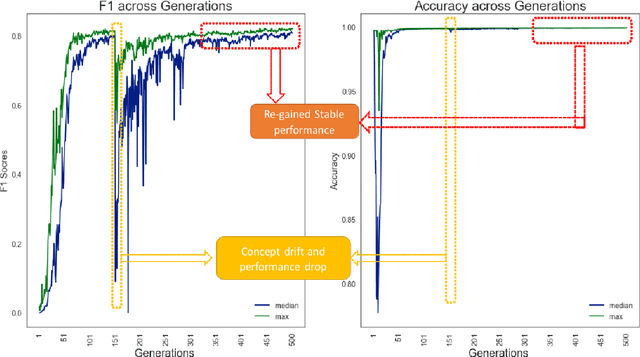
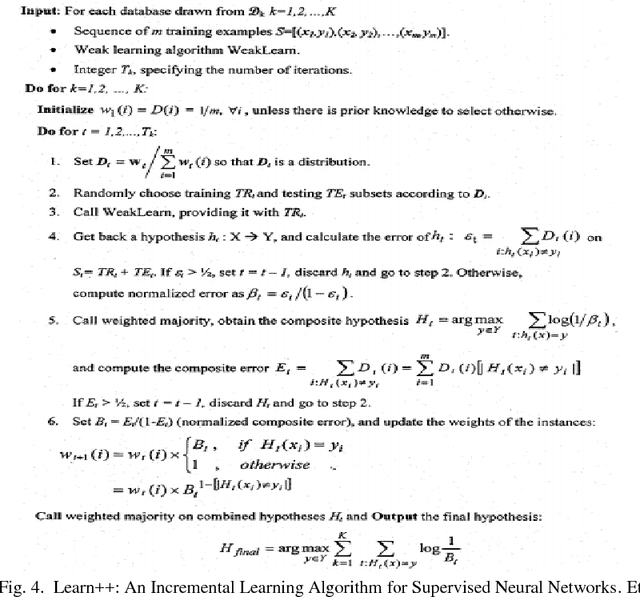
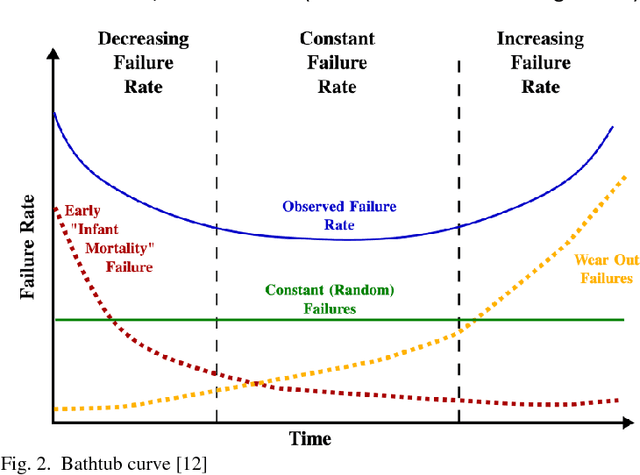
In statistical modelling the biggest threat is concept drift which makes the model gradually showing deteriorating performance over time. There are state of the art methodologies to detect the impact of concept drift, however general strategy considered to overcome the issue in performance is to rebuild or re-calibrate the model periodically as the variable patterns for the model changes significantly due to market change or consumer behavior change etc. Quantitative research is the most widely spread application of data science in Marketing or financial domain where applicability of state of the art reinforcement learning for auto-learning is less explored paradigm. Reinforcement learning is heavily dependent on having a simulated environment which is majorly available for gaming or online systems, to learn from the live feedback. However, there are some research happened on the area of online advertisement, pricing etc where due to the nature of the online learning environment scope of reinforcement learning is explored. Our proposed solution is a reinforcement learning based, true self-learning algorithm which can adapt to the data change or concept drift and auto learn and self-calibrate for the new patterns of the data solving the problem of concept drift. Keywords - Reinforcement learning, Genetic Algorithm, Q-learning, Classification modelling, CMA-ES, NES, Multi objective optimization, Concept drift, Population stability index, Incremental learning, F1-measure, Predictive Modelling, Self-learning, MCTS, AlphaGo, AlphaZero
Proactive Intervention to Downtrend Employee Attrition using Artificial Intelligence Techniques
Jul 11, 2018To predict the employee attrition beforehand and to enable management to take individualized preventive action. Using Ensemble classification modeling techniques and Linear Regression. Model could predict over 91% accurate employee prediction, lead-time in separation and individual reasons causing attrition. Prior intimation of employee attrition enables manager to take preventive actions to retain employee or to manage the business consequences of attrition. Once deployed this will model can help in downtrend Employee Attrition, will help manager to manage team more effectively. Model does not cover the natural calamities, and unforeseen events occurring at an individual level like accident, death etc.
Personalized Influence Estimation Technique
May 25, 2018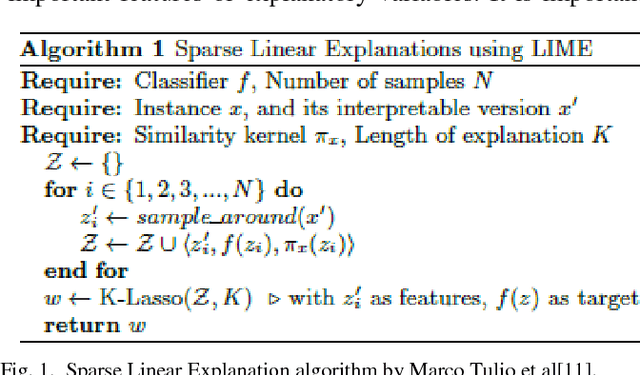
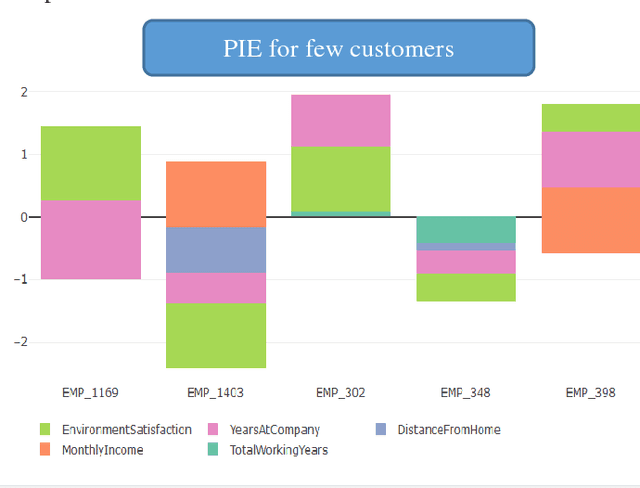
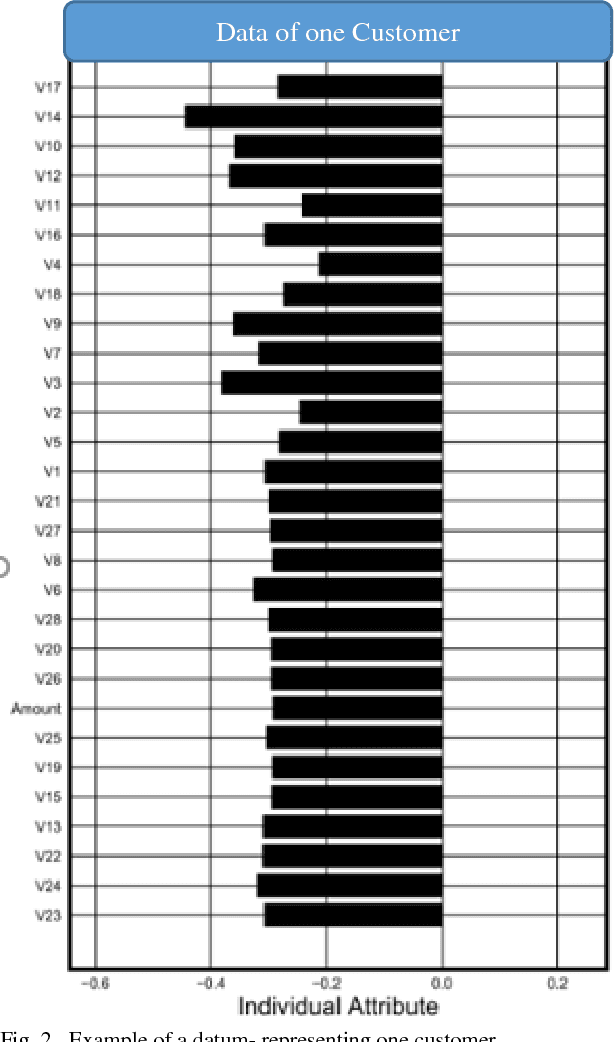
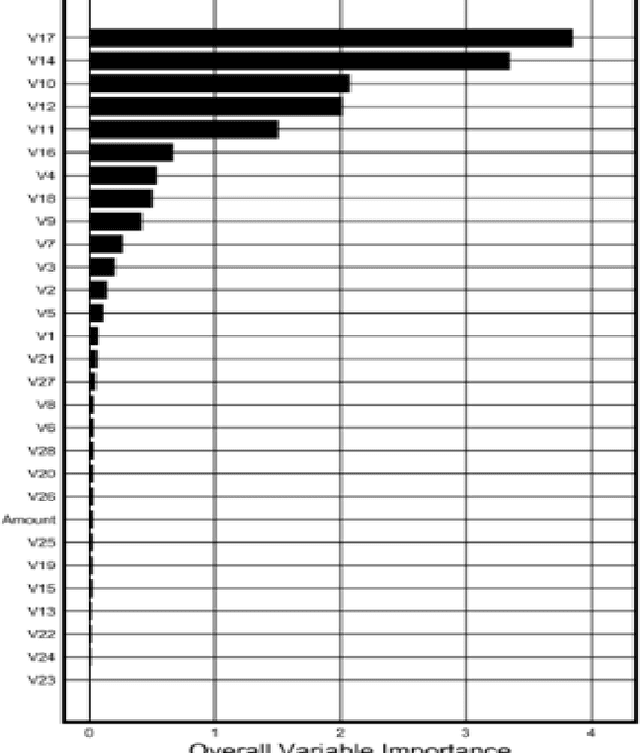
Customer Satisfaction is the most important factors in the industry irrespective of domain. Key Driver Analysis is a common practice in data science to help the business to evaluate the same. Understanding key features, which influence the outcome or dependent feature, is highly important in statistical model building. This helps to eliminate not so important factors from the model to minimize noise coming from the features, which does not contribute significantly enough to explain the behavior of the dependent feature, which we want to predict. Personalized Influence Estimation is a technique introduced in this paper, which can estimate key factor influence for individual observations, which contribute most for each observations behavior pattern based on the dependent class or estimate. Observations can come from multiple business problem i.e. customers related to satisfaction study, customer related to Fraud Detection, network devices for Fault detection etc. It is highly important to understand the cause of issue at each observation level to take appropriate Individualized action at customer level or device level etc. This technique is based on joint behavior of the feature dimension for the specific observation, and relative importance of the feature to estimate impact. The technique mentioned in this paper is aimed to help organizations to understand each respondents or observations individual key contributing factor of Influence. Result of the experiment is really encouraging and able to justify key reasons for churn for majority of the sample appropriately
Futuristic Classification with Dynamic Reference Frame Strategy
May 25, 2018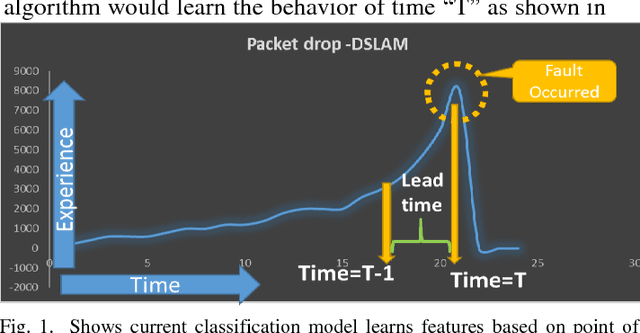
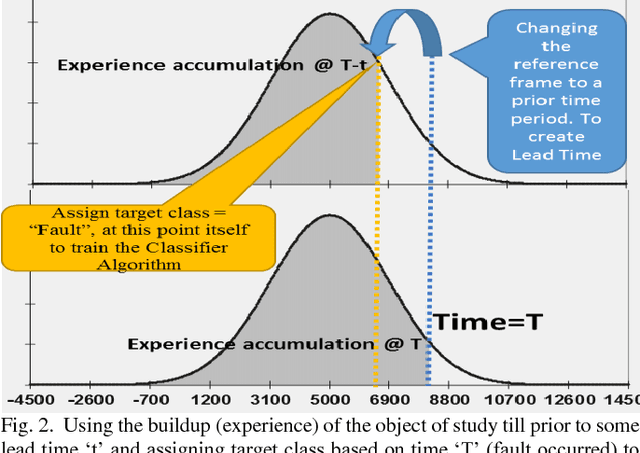
Classification is one of the widely used analytical techniques in data science domain across different business to associate a pattern which contribute to the occurrence of certain event which is predicted with some likelihood. This Paper address a lacuna of creating some time window before the prediction actually happen to enable organizations some space to act on the prediction. There are some really good state of the art machine learning techniques to optimally identify the possible churners in either customer base or employee base, similarly for fault prediction too if the prediction does not come with some buffer time to act on the fault it is very difficult to provide a seamless experience to the user. New concept of reference frame creation is introduced to solve this problem in this paper
Incremental Learning Framework Using Cloud Computing
May 12, 2018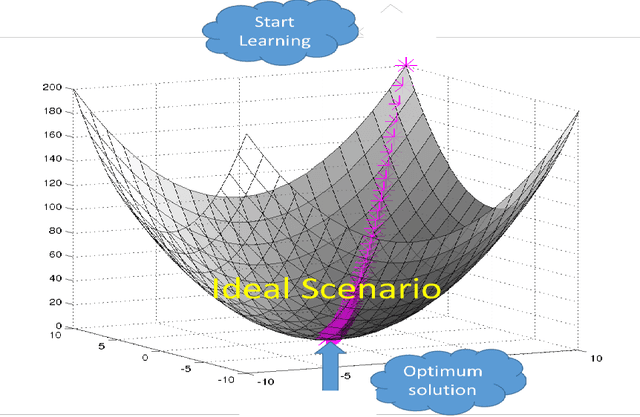
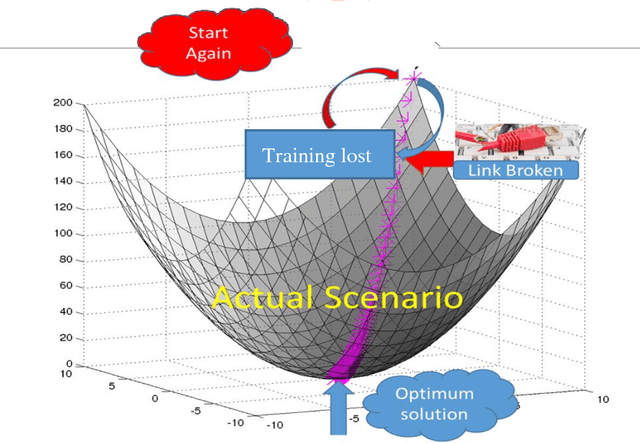
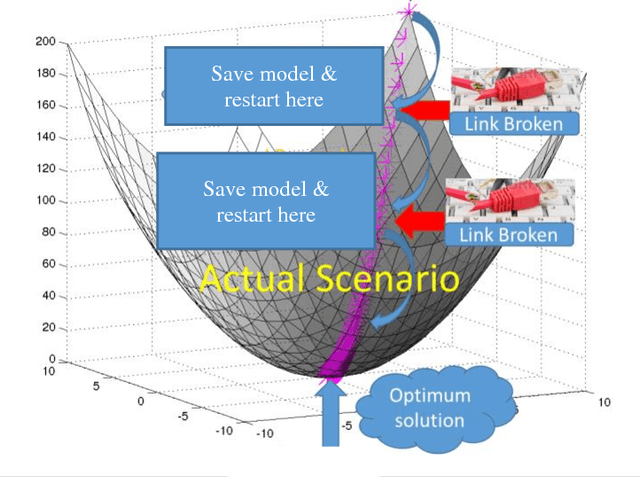
High volume of data, perceived as either challenge or opportunity. Deep learning architecture demands high volume of data to effectively back propagate and train the weights without bias. At the same time, large volume of data demands higher capacity of the machine where it could be executed seamlessly. Budding data scientist along with many research professionals face frequent disconnection issue with cloud computing framework (working without dedicated connection) due to free subscription to the platform. Similar issues also visible while working on local computer where computer may run out of resource or power sometimes and researcher has to start training the models all over again. In this paper, we intend to provide a way to resolve this issue and progressively training the neural network even after having frequent disconnection or resource outage without loosing much of the progress
Distribution Assertive Regression
May 04, 2018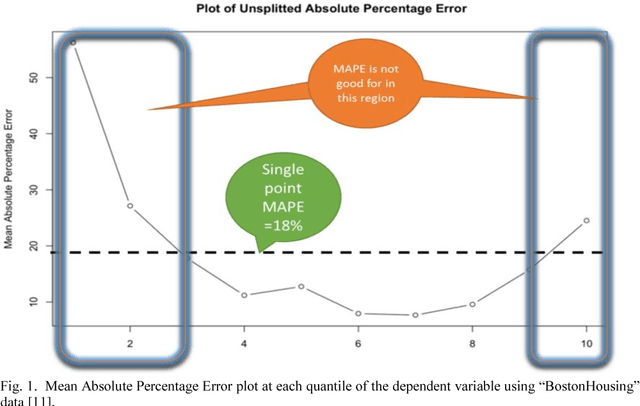
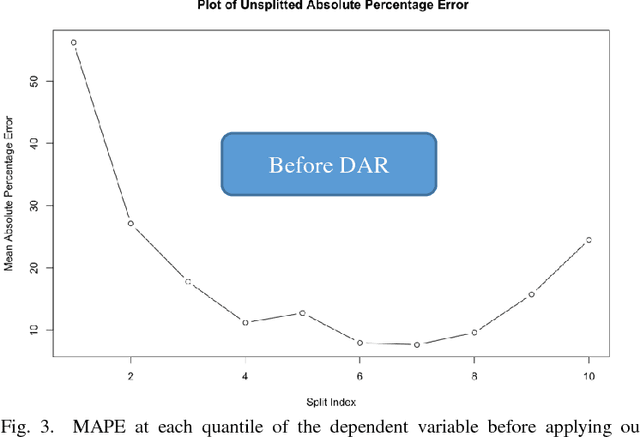
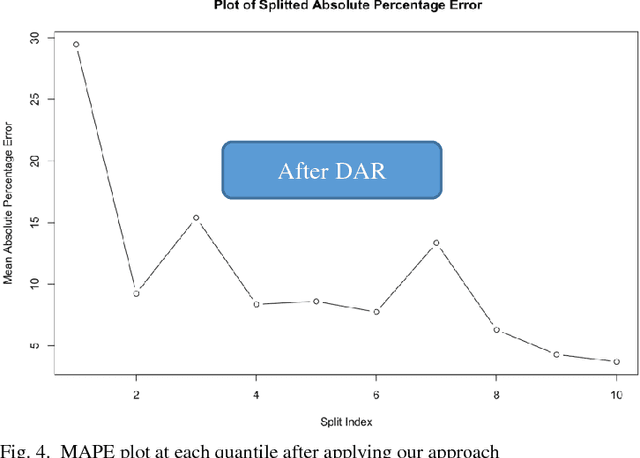
In regression modelling approach, the main step is to fit the regression line as close as possible to the target variable. In this process most algorithms try to fit all of the data in a single line and hence fitting all parts of target variable in one go. It was observed that the error between predicted and target variable usually have a varying behavior across the various quantiles of the dependent variable and hence single point diagnostic like MAPE has its limitation to signify the level of fitness across the distribution of Y(dependent variable). To address this problem, a novel approach is proposed in the paper to deal with regression fitting over various quantiles of target variable. Using this approach we have significantly improved the eccentric behavior of the distance (error) between predicted and actual value of regression. Our proposed solution is based on understanding the segmented behavior of the data with respect to the internal segments within the data and approach for retrospectively fitting the data based on each quantile behavior. We believe exploring and using this approach would help in achieving better and more explainable results in most settings of real world data modelling problems.