 Add to Chrome
 Add to Firefox
 Add to Edge
A CNN based method for Sub-pixel Urban Land Cover Classification using Landsat-5 TM and Resourcesat-1 LISS-IV Imagery
Dec 16, 2021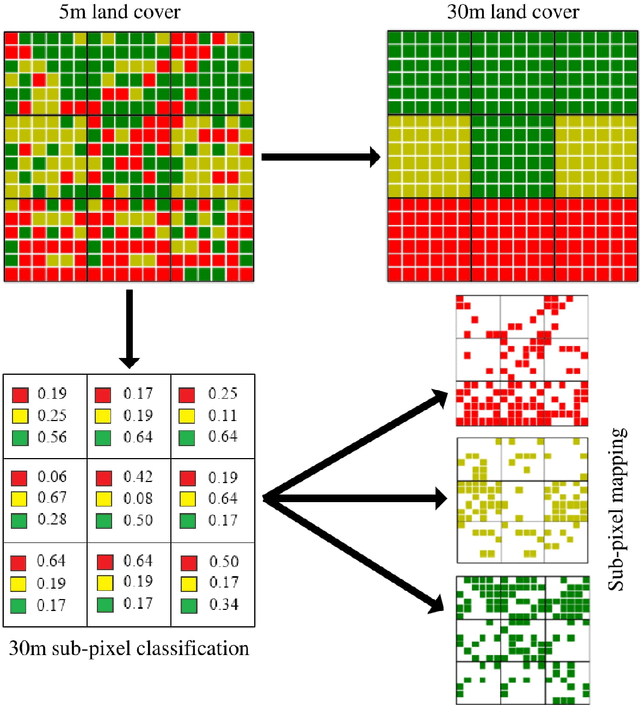
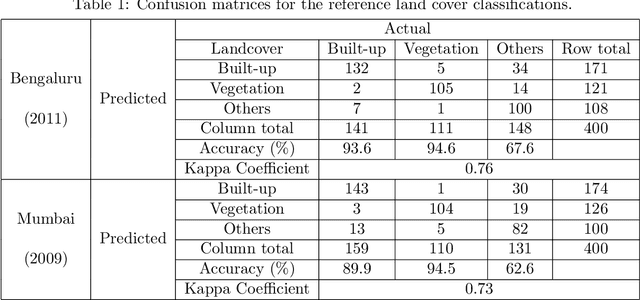
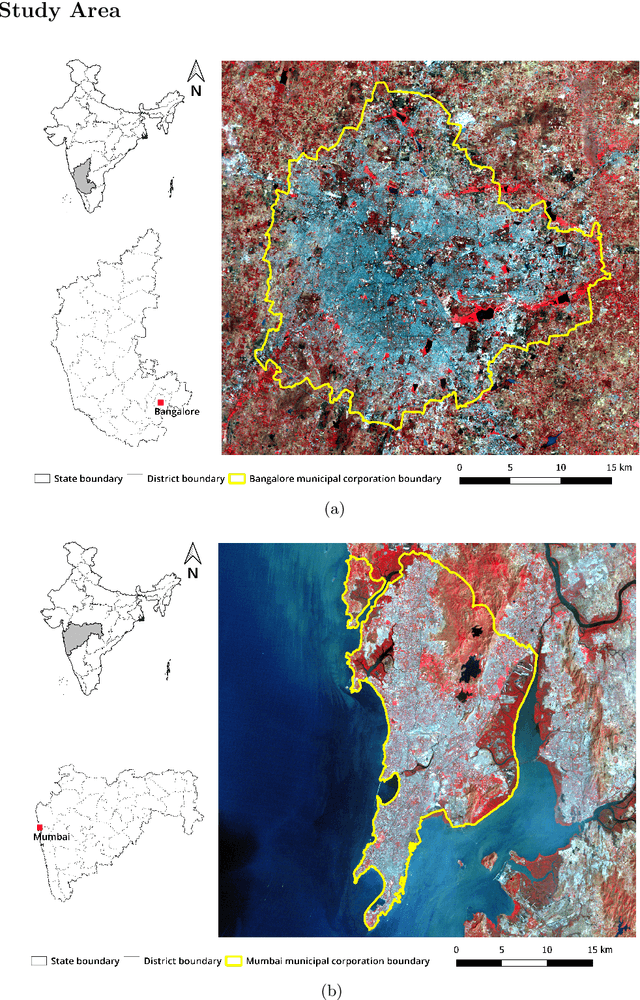
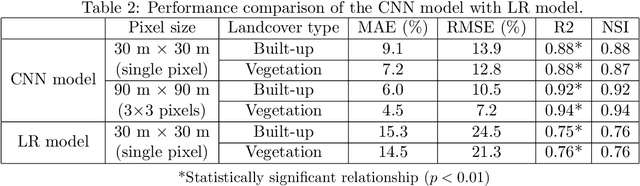
Time series data of urban land cover is of great utility in analyzing urban growth patterns, changes in distribution of impervious surface and vegetation and resulting impacts on urban micro climate. While Landsat data is ideal for such analysis due to the long time series of free imagery, traditional per-pixel hard classification fails to yield full potential of the Landsat data. This paper proposes a sub-pixel classification method that leverages the temporal overlap of Landsat-5 TM and Resourcesat-1 LISS-IV sensors. We train a convolutional neural network to predict fractional land cover maps from 30m Landsat-5 TM data. The reference land cover fractions are estimated from a hard-classified 5.8m LISS-IV image for Bengaluru from 2011. Further, we demonstrate the generalizability and superior performance of the proposed model using data for Mumbai from 2009 and comparing it to the results obtained using a Random Forest classifier. For both Bengaluru (2011) and Mumbai (2009) data, Mean Absolute Percentage Error of our CNN model is in the range of 7.2 to 11.3 for both built-up and vegetation fraction prediction at the 30m cell level. Unlike most recent studies where validation is conducted using data for a limited spatial extent, our model has been trained and validated using data for the complete spatial extent of two mega cities for two different time periods. Hence it can reliably generate 30m built-up and vegetation fraction maps from Landsat-5 TM time series data to analyze long term urban growth patterns.
Global Built-up and Population Datasets: Which ones should you use for India?
Aug 24, 2021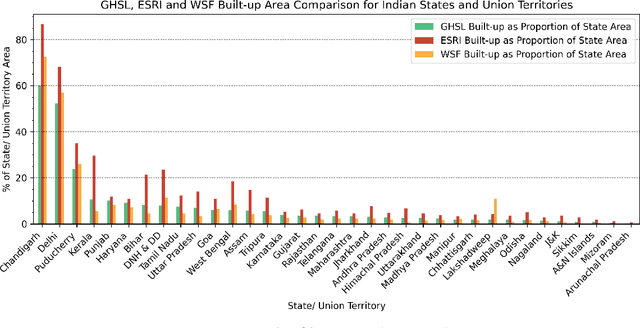
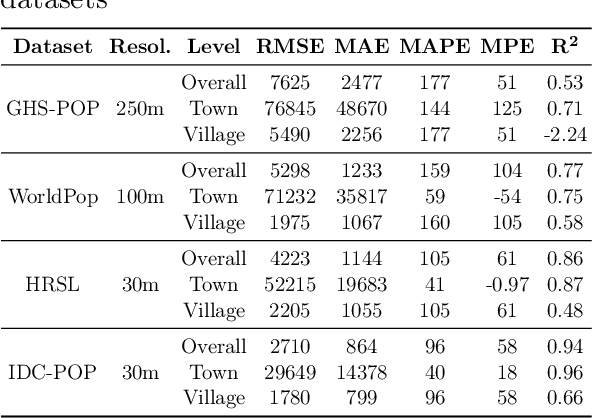
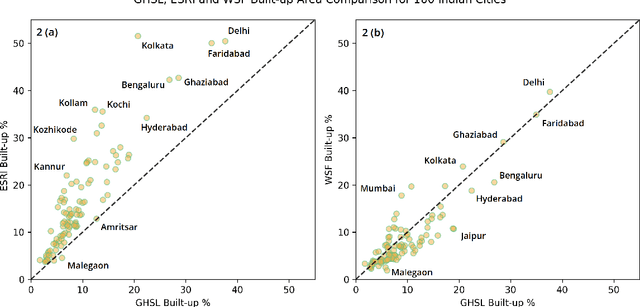
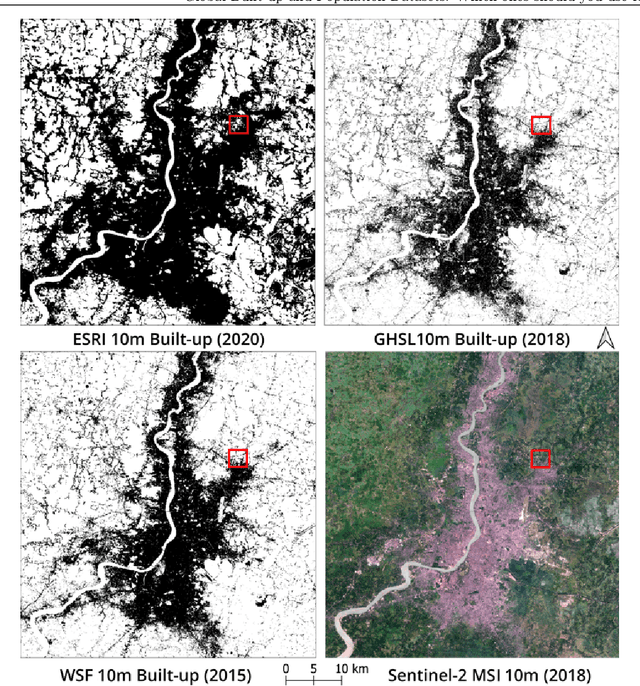
Multiple global land cover and population distribution datasets are currently available in the public domain. Given the differences between these datasets and the possibility that their accuracy may vary across countries, it is imperative that users have clear guidance on which datasets are appropriate for specific settings and objectives. Here we assess the accuracy of three global 10m resolution built-up datasets (ESRI, GHS-BUILT-S2 and WSF) and three population distribution datasets (HRSL 30m, WorldPop 100m, GHS-POP 250m) for India. Among built-up datasets, the GHS-BUILT-S2 is the most suitable for India for the 2015-2020 time period. To assess accuracy of population distribution datasets we use data from the 2011 Census of India at the level of 37,137 village and town polygons for the state of Bihar in India. Among the global datasets, HRSL has the best results. We also compute error metrics for IDC-POP, a 30m resolution population dataset generated by us at the Indian Institute for Human Settlements. For Bihar, IDC-POP outperforms all three global datasets.