 Add to Chrome
 Add to Firefox
 Add to Edge
Learning Graphical Models With Hubs
Aug 09, 2014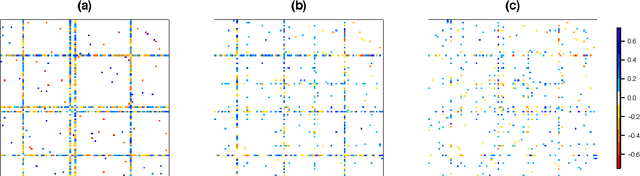
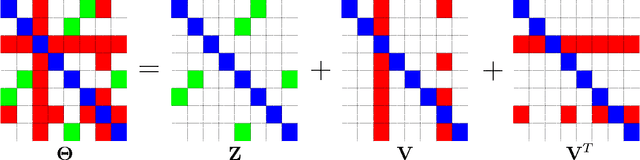
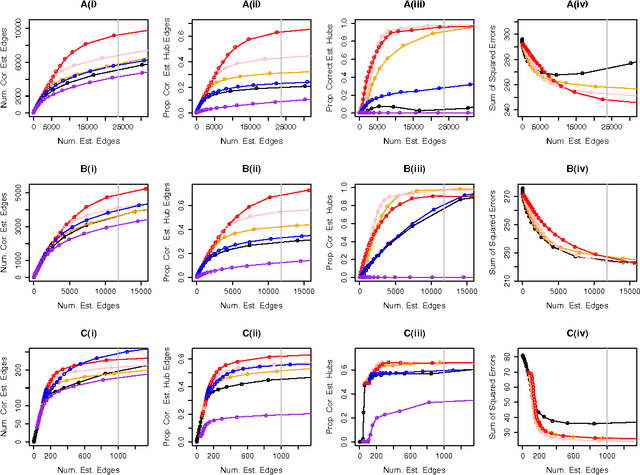
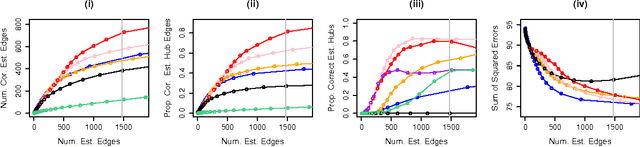
We consider the problem of learning a high-dimensional graphical model in which certain hub nodes are highly-connected to many other nodes. Many authors have studied the use of an l1 penalty in order to learn a sparse graph in high-dimensional setting. However, the l1 penalty implicitly assumes that each edge is equally likely and independent of all other edges. We propose a general framework to accommodate more realistic networks with hub nodes, using a convex formulation that involves a row-column overlap norm penalty. We apply this general framework to three widely-used probabilistic graphical models: the Gaussian graphical model, the covariance graph model, and the binary Ising model. An alternating direction method of multipliers algorithm is used to solve the corresponding convex optimization problems. On synthetic data, we demonstrate that our proposed framework outperforms competitors that do not explicitly model hub nodes. We illustrate our proposal on a webpage data set and a gene expression data set.
The Cluster Graphical Lasso for improved estimation of Gaussian graphical models
Jul 19, 2013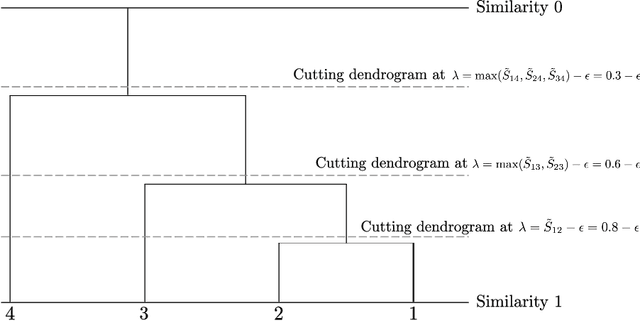
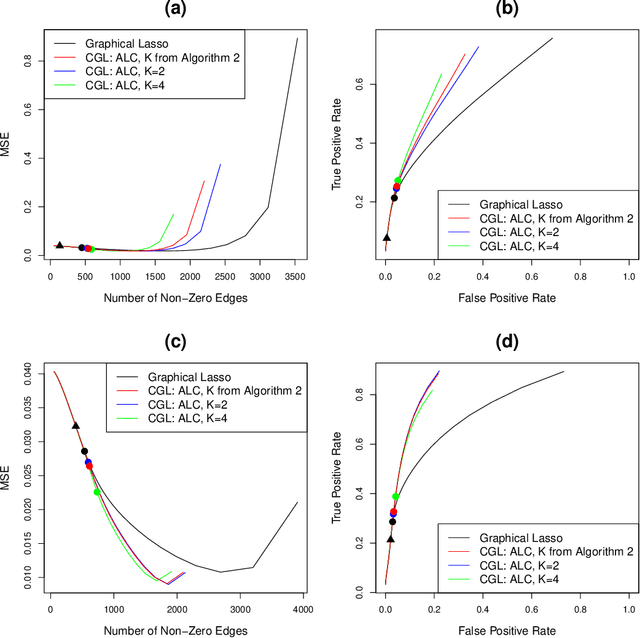
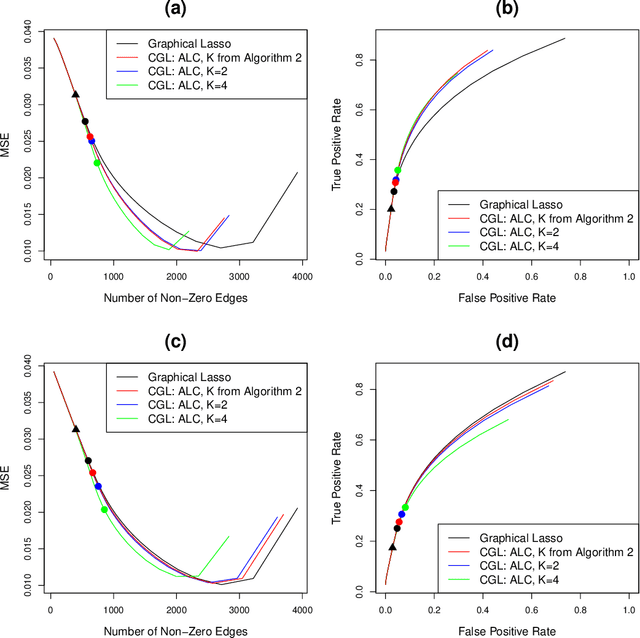
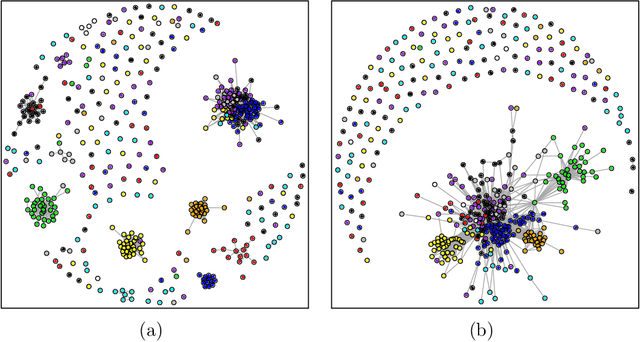
We consider the task of estimating a Gaussian graphical model in the high-dimensional setting. The graphical lasso, which involves maximizing the Gaussian log likelihood subject to an l1 penalty, is a well-studied approach for this task. We begin by introducing a surprising connection between the graphical lasso and hierarchical clustering: the graphical lasso in effect performs a two-step procedure, in which (1) single linkage hierarchical clustering is performed on the variables in order to identify connected components, and then (2) an l1-penalized log likelihood is maximized on the subset of variables within each connected component. In other words, the graphical lasso determines the connected components of the estimated network via single linkage clustering. Unfortunately, single linkage clustering is known to perform poorly in certain settings. Therefore, we propose the cluster graphical lasso, which involves clustering the features using an alternative to single linkage clustering, and then performing the graphical lasso on the subset of variables within each cluster. We establish model selection consistency for this technique, and demonstrate its improved performance relative to the graphical lasso in a simulation study, as well as in applications to an equities data set, a university webpage data set, and a gene expression data set.