 Add to Chrome
 Add to Firefox
 Add to Edge
Persistent Multiscale Density-based Clustering
Dec 18, 2025


Clustering is a cornerstone of modern data analysis. Detecting clusters in exploratory data analyses (EDA) requires algorithms that make few assumptions about the data. Density-based clustering algorithms are particularly well-suited for EDA because they describe high-density regions, assuming only that a density exists. Applying density-based clustering algorithms in practice, however, requires selecting appropriate hyperparameters, which is difficult without prior knowledge of the data distribution. For example, DBSCAN requires selecting a density threshold, and HDBSCAN* relies on a minimum cluster size parameter. In this work, we propose Persistent Leaves Spatial Clustering for Applications with Noise (PLSCAN). This novel density-based clustering algorithm efficiently identifies all minimum cluster sizes for which HDBSCAN* produces stable (leaf) clusters. PLSCAN applies scale-space clustering principles and is equivalent to persistent homology on a novel metric space. We compare its performance to HDBSCAN* on several real-world datasets, demonstrating that it achieves a higher average ARI and is less sensitive to changes in the number of mutual reachability neighbours. Additionally, we compare PLSCAN's computational costs to k-Means, demonstrating competitive run-times on low-dimensional datasets. At higher dimensions, run times scale more similarly to HDBSCAN*.
Lens functions for exploring UMAP Projections with Domain Knowledge
May 15, 2024


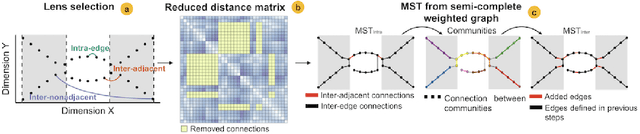
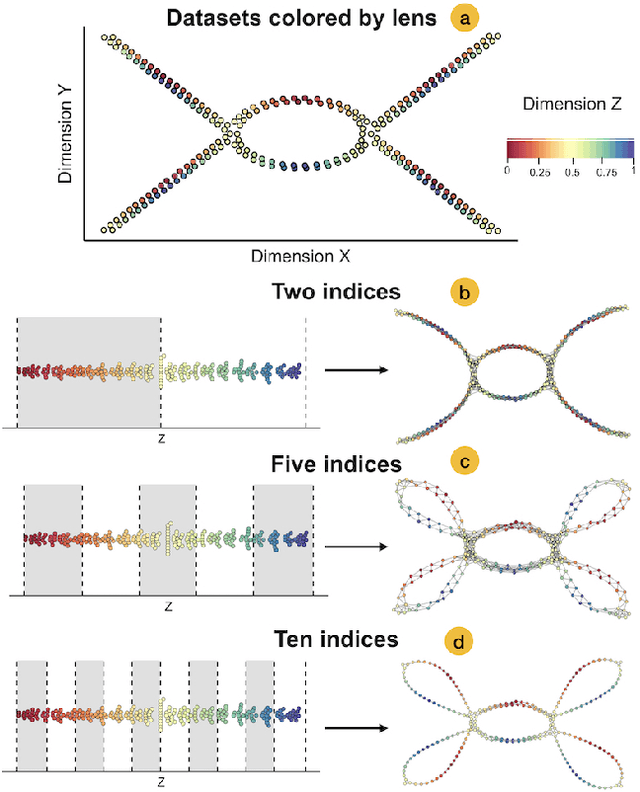
Dimensionality reduction algorithms are often used to visualise high-dimensional data. Previously, studies have used prior information to enhance or suppress expected patterns in projections. In this paper, we adapt such techniques for domain knowledge guided interactive exploration. Inspired by Mapper and STAD, we present three types of lens functions for UMAP, a state-of-the-art dimensionality reduction algorithm. Lens functions enable analysts to adapt projections to their questions, revealing otherwise hidden patterns. They filter the modelled connectivity to explore the interaction between manually selected features and the data's structure, creating configurable perspectives each potentially revealing new insights. The effectiveness of the lens functions is demonstrated in two use cases and their computational cost is analysed in a synthetic benchmark. Our implementation is available in an open-source Python package: https://github.com/vda-lab/lensed_umap.
Improving the Projection of Global Structures in Data through Spanning Trees
Jul 12, 2019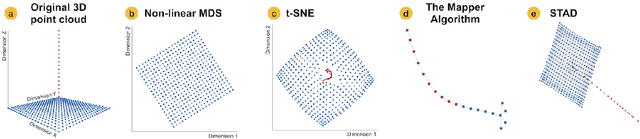
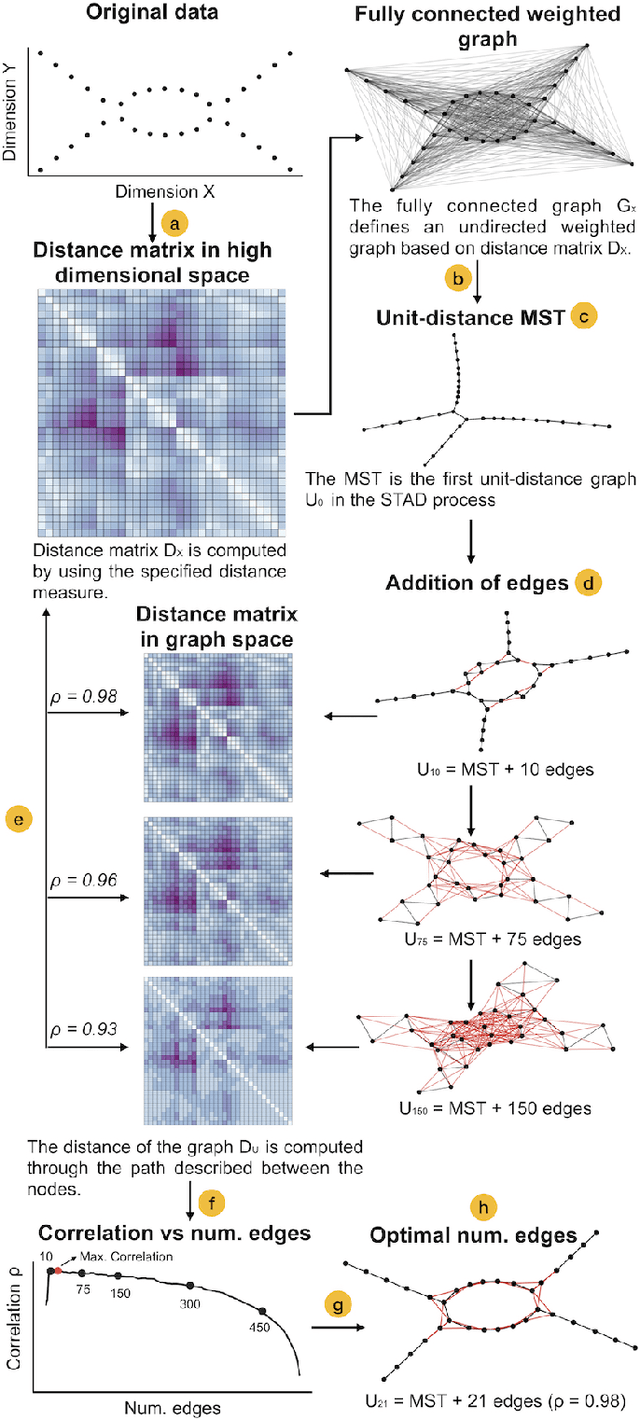
The connection of edges in a graph generates a structure that is independent of a coordinate system. This visual metaphor allows creating a more flexible representation of data than a two-dimensional scatterplot. In this work, we present STAD (Spanning Trees as Approximation of Data), a dimensionality reduction method to approximate the high-dimensional structure into a graph with or without formulating prior hypotheses. STAD generates an abstract representation of high-dimensional data by giving each data point a location in a graph which preserves the distances in the original high-dimensional space. The STAD graph is built upon the Minimum Spanning Tree (MST) to which new edges are added until the correlation between the distances from the graph and the original dataset is maximized. Additionally, STAD supports the inclusion of additional functions to focus the exploration and allow the analysis of data from new perspectives, emphasizing traits in data which otherwise would remain hidden. We demonstrate the effectiveness of our method by applying it to two real-world datasets: traffic density in Barcelona and temporal measurements of air quality in Castile and Le\'on in Spain.