 Add to Chrome
 Add to Firefox
 Add to Edge
Trend Filtered Mixture of Experts for Automated Gating of High-Frequency Flow Cytometry Data
Apr 16, 2025Ocean microbes are critical to both ocean ecosystems and the global climate. Flow cytometry, which measures cell optical properties in fluid samples, is routinely used in oceanographic research. Despite decades of accumulated data, identifying key microbial populations (a process known as ``gating'') remains a significant analytical challenge. To address this, we focus on gating multidimensional, high-frequency flow cytometry data collected {\it continuously} on board oceanographic research vessels, capturing time- and space-wise variations in the dynamic ocean. Our paper proposes a novel mixture-of-experts model in which both the gating function and the experts are given by trend filtering. The model leverages two key assumptions: (1) Each snapshot of flow cytometry data is a mixture of multivariate Gaussians and (2) the parameters of these Gaussians vary smoothly over time. Our method uses regularization and a constraint to ensure smoothness and that cluster means match biologically distinct microbe types. We demonstrate, using flow cytometry data from the North Pacific Ocean, that our proposed model accurately matches human-annotated gating and corrects significant errors.
Decomposing Gaussians with Unknown Covariance
Sep 17, 2024


Common workflows in machine learning and statistics rely on the ability to partition the information in a data set into independent portions. Recent work has shown that this may be possible even when conventional sample splitting is not (e.g., when the number of samples $n=1$, or when observations are not independent and identically distributed). However, the approaches that are currently available to decompose multivariate Gaussian data require knowledge of the covariance matrix. In many important problems (such as in spatial or longitudinal data analysis, and graphical modeling), the covariance matrix may be unknown and even of primary interest. Thus, in this work we develop new approaches to decompose Gaussians with unknown covariance. First, we present a general algorithm that encompasses all previous decomposition approaches for Gaussian data as special cases, and can further handle the case of an unknown covariance. It yields a new and more flexible alternative to sample splitting when $n>1$. When $n=1$, we prove that it is impossible to partition the information in a multivariate Gaussian into independent portions without knowing the covariance matrix. Thus, we use the general algorithm to decompose a single multivariate Gaussian with unknown covariance into dependent parts with tractable conditional distributions, and demonstrate their use for inference and validation. The proposed decomposition strategy extends naturally to Gaussian processes. In simulation and on electroencephalography data, we apply these decompositions to the tasks of model selection and post-selection inference in settings where alternative strategies are unavailable.
Predicting Rare Events by Shrinking Towards Proportional Odds
May 30, 2023


Training classifiers is difficult with severe class imbalance, but many rare events are the culmination of a sequence with much more common intermediate outcomes. For example, in online marketing a user first sees an ad, then may click on it, and finally may make a purchase; estimating the probability of purchases is difficult because of their rarity. We show both theoretically and through data experiments that the more abundant data in earlier steps may be leveraged to improve estimation of probabilities of rare events. We present PRESTO, a relaxation of the proportional odds model for ordinal regression. Instead of estimating weights for one separating hyperplane that is shifted by separate intercepts for each of the estimated Bayes decision boundaries between adjacent pairs of categorical responses, we estimate separate weights for each of these transitions. We impose an L1 penalty on the differences between weights for the same feature in adjacent weight vectors in order to shrink towards the proportional odds model. We prove that PRESTO consistently estimates the decision boundary weights under a sparsity assumption. Synthetic and real data experiments show that our method can estimate rare probabilities in this setting better than both logistic regression on the rare category, which fails to borrow strength from more abundant categories, and the proportional odds model, which is too inflexible.
Generalized Data Thinning Using Sufficient Statistics
Mar 22, 2023


Our goal is to develop a general strategy to decompose a random variable $X$ into multiple independent random variables, without sacrificing any information about unknown parameters. A recent paper showed that for some well-known natural exponential families, $X$ can be "thinned" into independent random variables $X^{(1)}, \ldots, X^{(K)}$, such that $X = \sum_{k=1}^K X^{(k)}$. In this paper, we generalize their procedure by relaxing this summation requirement and simply asking that some known function of the independent random variables exactly reconstruct $X$. This generalization of the procedure serves two purposes. First, it greatly expands the families of distributions for which thinning can be performed. Second, it unifies sample splitting and data thinning, which on the surface seem to be very different, as applications of the same principle. This shared principle is sufficiency. We use this insight to perform generalized thinning operations for a diverse set of families.
Inferring independent sets of Gaussian variables after thresholding correlations
Nov 02, 2022


We consider testing whether a set of Gaussian variables, selected from the data, is independent of the remaining variables. We assume that this set is selected via a very simple approach that is commonly used across scientific disciplines: we select a set of variables for which the correlation with all variables outside the set falls below some threshold. Unlike other settings in selective inference, failure to account for the selection step leads, in this setting, to excessively conservative (as opposed to anti-conservative) results. Our proposed test properly accounts for the fact that the set of variables is selected from the data, and thus is not overly conservative. To develop our test, we condition on the event that the selection resulted in the set of variables in question. To achieve computational tractability, we develop a new characterization of the conditioning event in terms of the canonical correlation between the groups of random variables. In simulation studies and in the analysis of gene co-expression networks, we show that our approach has much higher power than a ``naive'' approach that ignores the effect of selection.
Prediction Sets for High-Dimensional Mixture of Experts Models
Oct 30, 2022


Large datasets make it possible to build predictive models that can capture heterogenous relationships between the response variable and features. The mixture of high-dimensional linear experts model posits that observations come from a mixture of high-dimensional linear regression models, where the mixture weights are themselves feature-dependent. In this paper, we show how to construct valid prediction sets for an $\ell_1$-penalized mixture of experts model in the high-dimensional setting. We make use of a debiasing procedure to account for the bias induced by the penalization and propose a novel strategy for combining intervals to form a prediction set with coverage guarantees in the mixture setting. Synthetic examples and an application to the prediction of critical temperatures of superconducting materials show our method to have reliable practical performance.
Cluster Stability Selection
Jan 03, 2022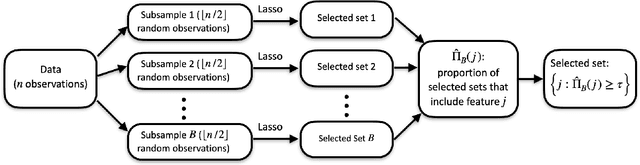
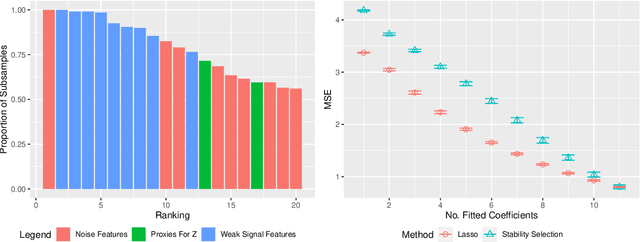
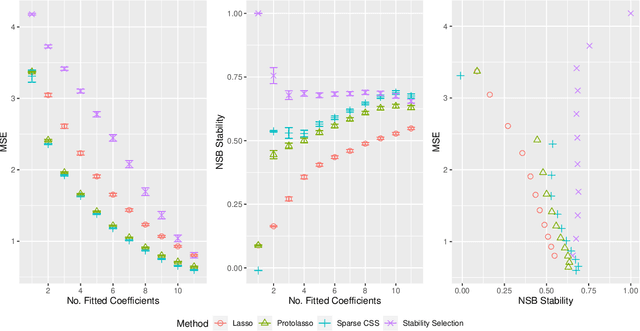
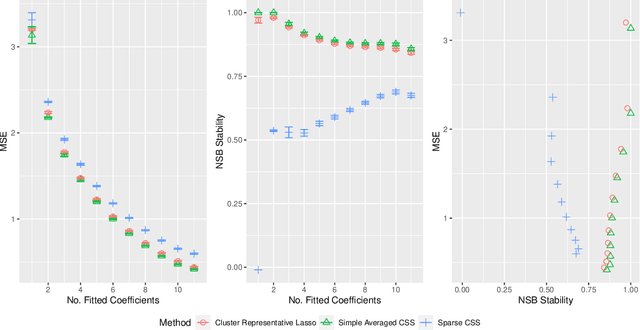
Stability selection (Meinshausen and Buhlmann, 2010) makes any feature selection method more stable by returning only those features that are consistently selected across many subsamples. We prove (in what is, to our knowledge, the first result of its kind) that for data containing highly correlated proxies for an important latent variable, the lasso typically selects one proxy, yet stability selection with the lasso can fail to select any proxy, leading to worse predictive performance than the lasso alone. We introduce cluster stability selection, which exploits the practitioner's knowledge that highly correlated clusters exist in the data, resulting in better feature rankings than stability selection in this setting. We consider several feature-combination approaches, including taking a weighted average of the features in each important cluster where weights are determined by the frequency with which cluster members are selected, which we show leads to better predictive models than previous proposals. We present generalizations of theoretical guarantees from Meinshausen and Buhlmann (2010) and Shah and Samworth (2012) to show that cluster stability selection retains the same guarantees. In summary, cluster stability selection enjoys the best of both worlds, yielding a sparse selected set that is both stable and has good predictive performance.
Controlling the False Split Rate in Tree-Based Aggregation
Aug 11, 2021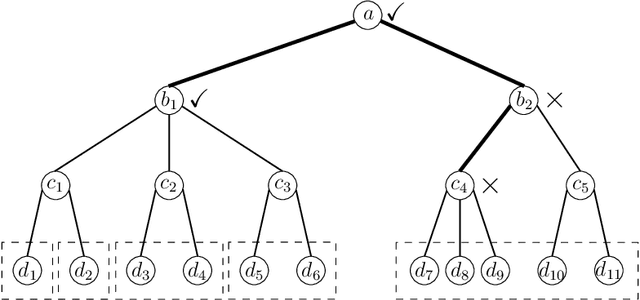
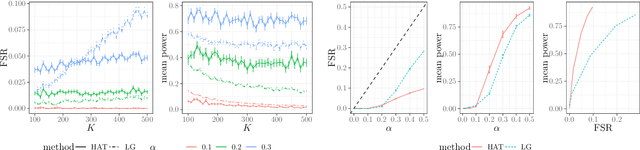
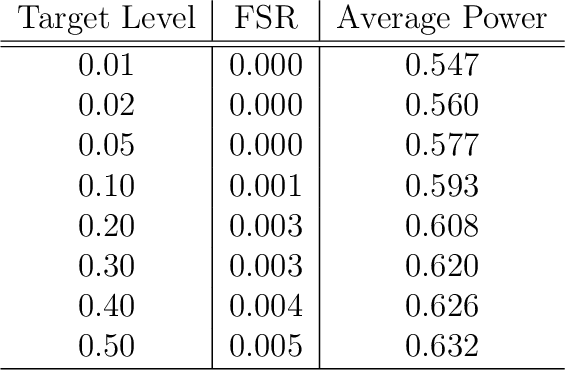
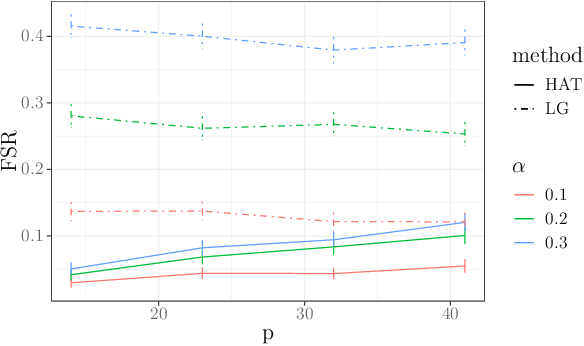
In many domains, data measurements can naturally be associated with the leaves of a tree, expressing the relationships among these measurements. For example, companies belong to industries, which in turn belong to ever coarser divisions such as sectors; microbes are commonly arranged in a taxonomic hierarchy from species to kingdoms; street blocks belong to neighborhoods, which in turn belong to larger-scale regions. The problem of tree-based aggregation that we consider in this paper asks which of these tree-defined subgroups of leaves should really be treated as a single entity and which of these entities should be distinguished from each other. We introduce the "false split rate", an error measure that describes the degree to which subgroups have been split when they should not have been. We then propose a multiple hypothesis testing algorithm for tree-based aggregation, which we prove controls this error measure. We focus on two main examples of tree-based aggregation, one which involves aggregating means and the other which involves aggregating regression coefficients. We apply this methodology to aggregate stocks based on their volatility and to aggregate neighborhoods of New York City based on taxi fares.
Tree-based Node Aggregation in Sparse Graphical Models
Jan 29, 2021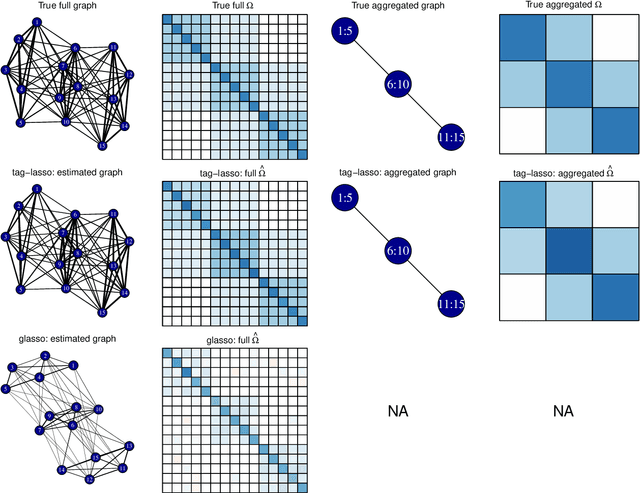
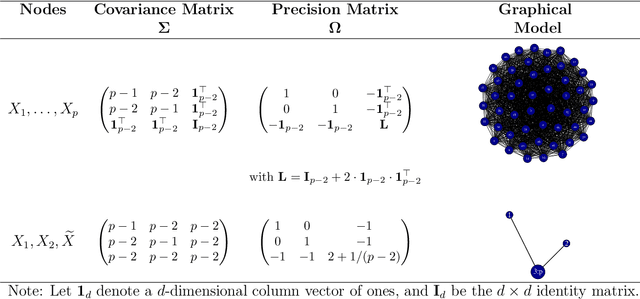
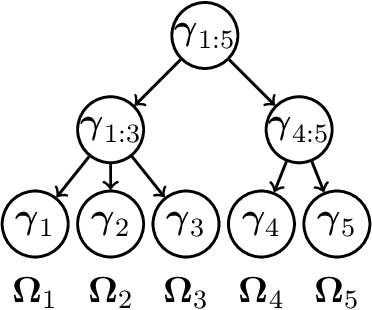
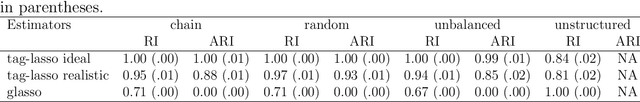
High-dimensional graphical models are often estimated using regularization that is aimed at reducing the number of edges in a network. In this work, we show how even simpler networks can be produced by aggregating the nodes of the graphical model. We develop a new convex regularized method, called the tree-aggregated graphical lasso or tag-lasso, that estimates graphical models that are both edge-sparse and node-aggregated. The aggregation is performed in a data-driven fashion by leveraging side information in the form of a tree that encodes node similarity and facilitates the interpretation of the resulting aggregated nodes. We provide an efficient implementation of the tag-lasso by using the locally adaptive alternating direction method of multipliers and illustrate our proposal's practical advantages in simulation and in applications in finance and biology.
Selective Inference for Hierarchical Clustering
Dec 05, 2020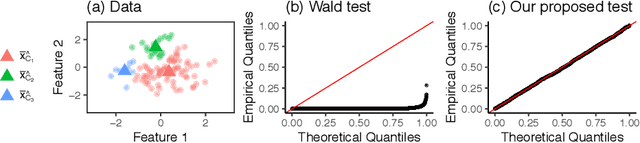
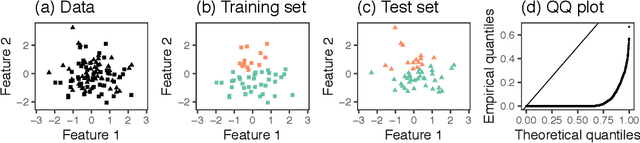
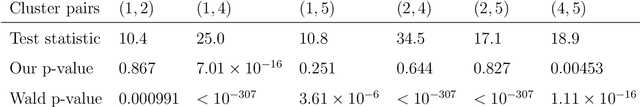
Testing for a difference in means between two groups is fundamental to answering research questions across virtually every scientific area. Classical tests control the Type I error rate when the groups are defined a priori. However, when the groups are instead defined via a clustering algorithm, then applying a classical test for a difference in means between the groups yields an extremely inflated Type I error rate. Notably, this problem persists even if two separate and independent data sets are used to define the groups and to test for a difference in their means. To address this problem, in this paper, we propose a selective inference approach to test for a difference in means between two clusters obtained from any clustering method. Our procedure controls the selective Type I error rate by accounting for the fact that the null hypothesis was generated from the data. We describe how to efficiently compute exact p-values for clusters obtained using agglomerative hierarchical clustering with many commonly used linkages. We apply our method to simulated data and to single-cell RNA-seq data.