 Add to Chrome
 Add to Firefox
 Add to Edge
The Birkhoff completion of finite lattices
May 02, 2024


We introduce the Birkhoff completion as the smallest distributive lattice in which a given finite lattice can be embedded as semi-lattice. We discuss its relationship to implicational theories, in particular to R. Wille's simply-implicational theories. By an example, we show how the Birkhoff completion can be used as a tool for ordinal data science.
Conceptual Mapping of Controversies
Apr 25, 2024


With our work, we contribute towards a qualitative analysis of the discourse on controversies in online news media. For this, we employ Formal Concept Analysis and the economics of conventions to derive conceptual controversy maps. In our experiments, we analyze two maps from different news journals with methods from ordinal data science. We show how these methods can be used to assess the diversity, complexity and potential bias of controversies. In addition to that, we discuss how the diagrams of concept lattices can be used to navigate between news articles.
Towards Ordinal Data Science
Jul 13, 2023Order is one of the main instruments to measure the relationship between objects in (empirical) data. However, compared to methods that use numerical properties of objects, the amount of ordinal methods developed is rather small. One reason for this is the limited availability of computational resources in the last century that would have been required for ordinal computations. Another reason -- particularly important for this line of research -- is that order-based methods are often seen as too mathematically rigorous for applying them to real-world data. In this paper, we will therefore discuss different means for measuring and 'calculating' with ordinal structures -- a specific class of directed graphs -- and show how to infer knowledge from them. Our aim is to establish Ordinal Data Science as a fundamentally new research agenda. Besides cross-fertilization with other cornerstone machine learning and knowledge representation methods, a broad range of disciplines will benefit from this endeavor, including, psychology, sociology, economics, web science, knowledge engineering, scientometrics.
Automatic Textual Explanations of Concept Lattices
Apr 17, 2023Lattices and their order diagrams are an essential tool for communicating knowledge and insights about data. This is in particular true when applying Formal Concept Analysis. Such representations, however, are difficult to comprehend by untrained users and in general in cases where lattices are large. We tackle this problem by automatically generating textual explanations for lattices using standard scales. Our method is based on the general notion of ordinal motifs in lattices for the special case of standard scales. We show the computational complexity of identifying a small number of standard scales that cover most of the lattice structure. For these, we provide textual explanation templates, which can be applied to any occurrence of a scale in any data domain. These templates are derived using principles from human-computer interaction and allow for a comprehensive textual explanation of lattices. We demonstrate our approach on the spices planner data set, which is a medium sized formal context comprised of fifty-six meals (objects) and thirty-seven spices (attributes). The resulting 531 formal concepts can be covered by means of about 100 standard scales.
Ordinal Motifs in Lattices
Apr 10, 2023


Lattices are a commonly used structure for the representation and analysis of relational and ontological knowledge. In particular, the analysis of these requires a decomposition of a large and high-dimensional lattice into a set of understandably large parts. With the present work we propose /ordinal motifs/ as analytical units of meaning. We study these ordinal substructures (or standard scales) through (full) scale-measures of formal contexts from the field of formal concept analysis. We show that the underlying decision problems are NP-complete and provide results on how one can incrementally identify ordinal motifs to save computational effort. Accompanying our theoretical results, we demonstrate how ordinal motifs can be leveraged to retrieve basic meaning from a medium sized ordinal data set.
Maximal Ordinal Two-Factorizations
Apr 06, 2023


Given a formal context, an ordinal factor is a subset of its incidence relation that forms a chain in the concept lattice, i.e., a part of the dataset that corresponds to a linear order. To visualize the data in a formal context, Ganter and Glodeanu proposed a biplot based on two ordinal factors. For the biplot to be useful, it is important that these factors comprise as much data points as possible, i.e., that they cover a large part of the incidence relation. In this work, we investigate such ordinal two-factorizations. First, we investigate for formal contexts that omit ordinal two-factorizations the disjointness of the two factors. Then, we show that deciding on the existence of two-factorizations of a given size is an NP-complete problem which makes computing maximal factorizations computationally expensive. Finally, we provide the algorithm Ord2Factor that allows us to compute large ordinal two-factorizations.
Greedy Discovery of Ordinal Factors
Feb 19, 2023In large datasets, it is hard to discover and analyze structure. It is thus common to introduce tags or keywords for the items. In applications, such datasets are then filtered based on these tags. Still, even medium-sized datasets with a few tags result in complex and for humans hard-to-navigate systems. In this work, we adopt the method of ordinal factor analysis to address this problem. An ordinal factor arranges a subset of the tags in a linear order based on their underlying structure. A complete ordinal factorization, which consists of such ordinal factors, precisely represents the original dataset. Based on such an ordinal factorization, we provide a way to discover and explain relationships between different items and attributes in the dataset. However, computing even just one ordinal factor of high cardinality is computationally complex. We thus propose the greedy algorithm in this work. This algorithm extracts ordinal factors using already existing fast algorithms developed in formal concept analysis. Then, we leverage to propose a comprehensive way to discover relationships in the dataset. We furthermore introduce a distance measure based on the representation emerging from the ordinal factorization to discover similar items. To evaluate the method, we conduct a case study on different datasets.
Discovering Locally Maximal Bipartite Subgraphs
Nov 18, 2022


Induced bipartite subgraphs of maximal vertex cardinality are an essential concept for the analysis of graphs. Yet, discovering them in large graphs is known to be computationally hard. Therefore, we consider in this work a weaker notion of this problem, where we discard the maximality constraint in favor of inclusion maximality. Thus, we aim to discover locally maximal bipartite subgraphs. For this, we present three heuristic approaches to extract such subgraphs and compare their results to the solutions of the global problem. For the latter, we employ the algorithmic strength of fast SAT-solvers. Our three proposed heuristics are based on a greedy strategy, a simulated annealing approach, and a genetic algorithm, respectively. We evaluate all four algorithms with respect to their time requirement and the vertex cardinality of the discovered bipartite subgraphs on several benchmark datasets
Attribute Exploration with Multiple Contradicting Partial Experts
May 31, 2022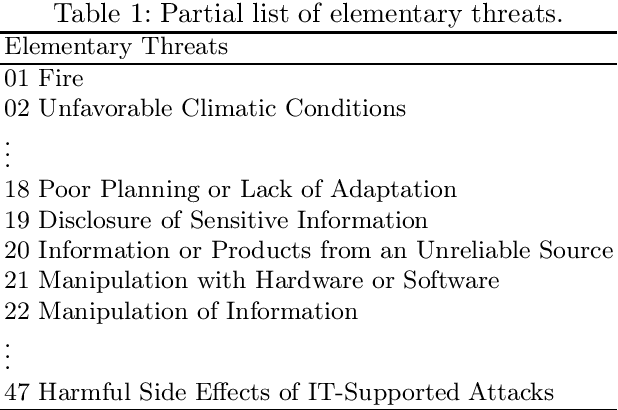
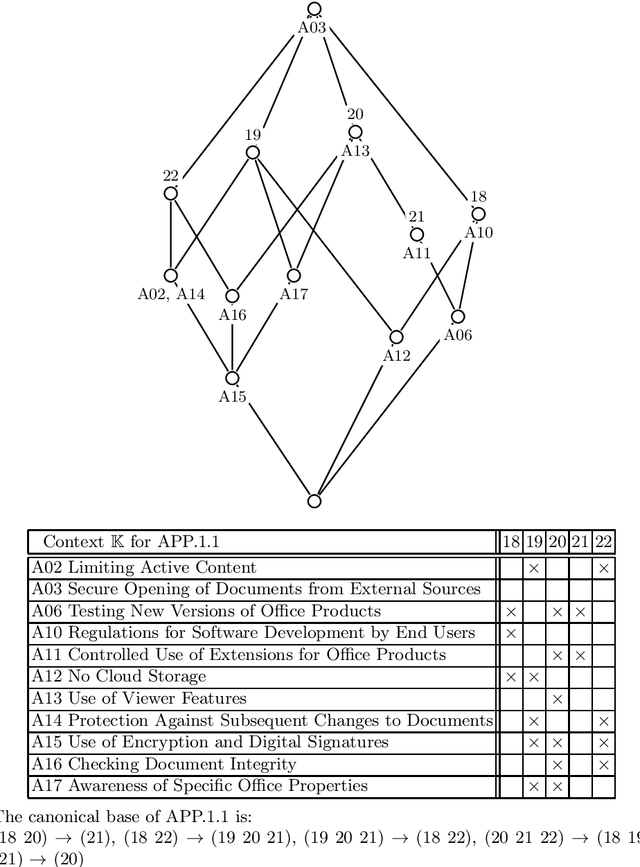
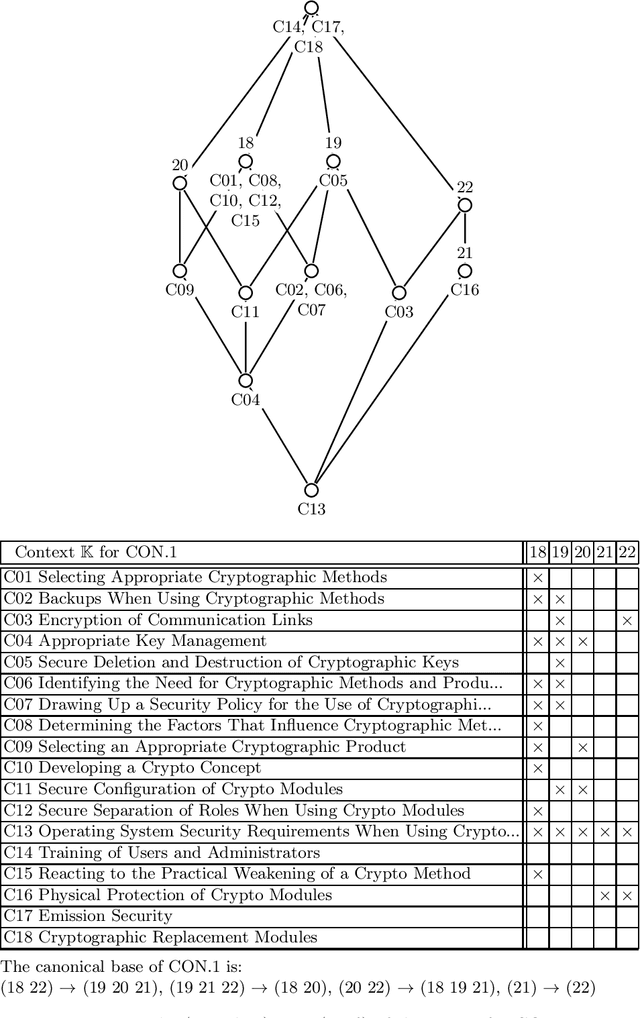
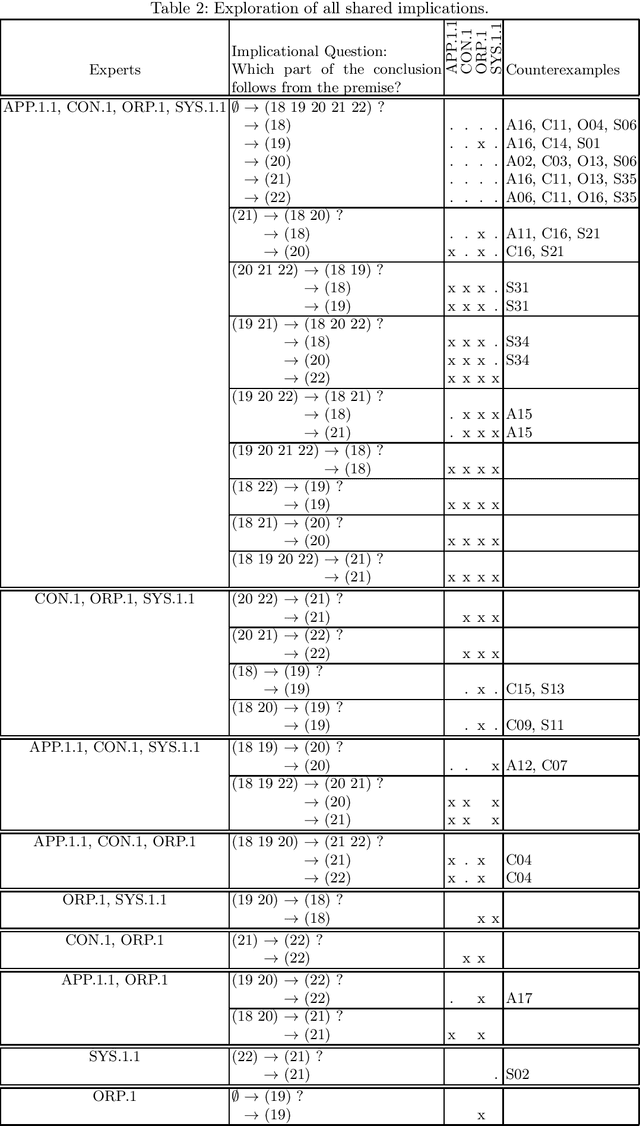
Attribute exploration is a method from Formal Concept Analysis (FCA) that helps a domain expert discover structural dependencies in knowledge domains which can be represented as formal contexts (cross tables of objects and attributes). In this paper we present an extension of attribute exploration that allows for a group of domain experts and explores their shared views. Each expert has their own view of the domain and the views of multiple experts may contain contradicting information.
Mapping Research Trajectories
Apr 25, 2022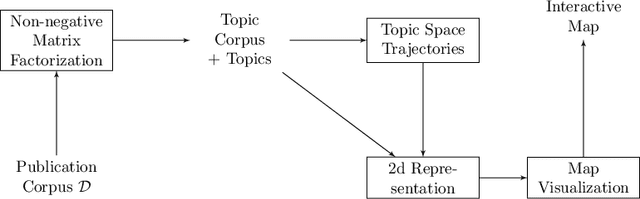
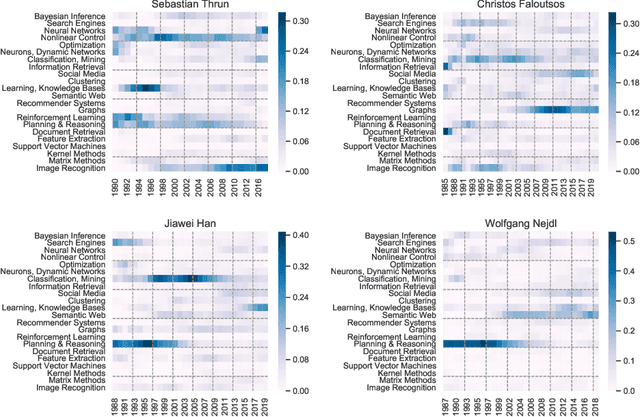
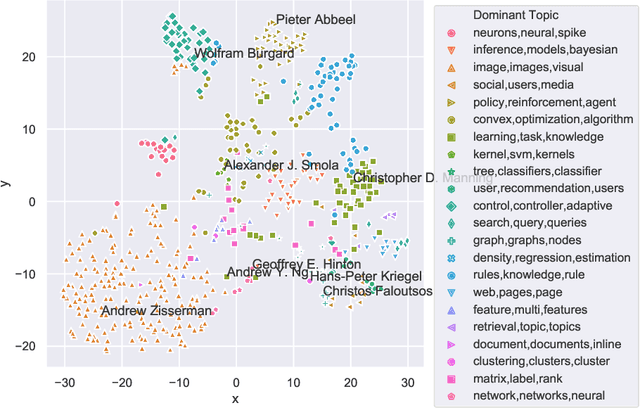
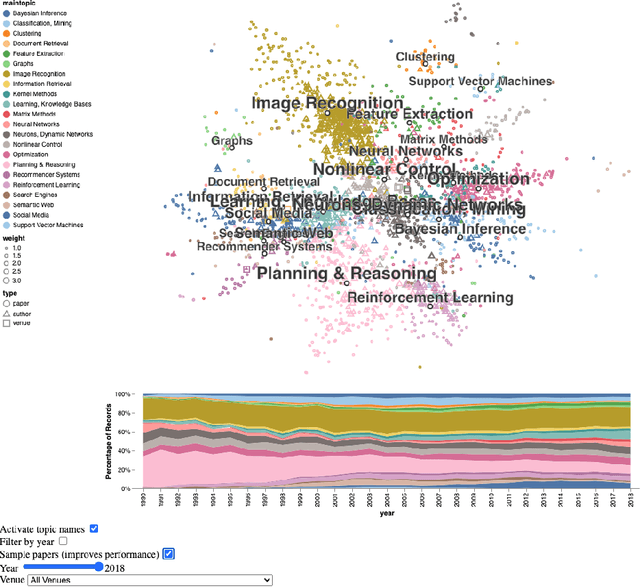
Steadily growing amounts of information, such as annually published scientific papers, have become so large that they elude an extensive manual analysis. Hence, to maintain an overview, automated methods for the mapping and visualization of knowledge domains are necessary and important, e.g., for scientific decision makers. Of particular interest in this field is the development of research topics of different entities (e.g., scientific authors and venues) over time. However, existing approaches for their analysis are only suitable for single entity types, such as venues, and they often do not capture the research topics or the time dimension in an easily interpretable manner. Hence, we propose a principled approach for \emph{mapping research trajectories}, which is applicable to all kinds of scientific entities that can be represented by sets of published papers. For this, we transfer ideas and principles from the geographic visualization domain, specifically trajectory maps and interactive geographic maps. Our visualizations depict the research topics of entities over time in a straightforward interpr. manner. They can be navigated by the user intuitively and restricted to specific elements of interest. The maps are derived from a corpus of research publications (i.e., titles and abstracts) through a combination of unsupervised machine learning methods. In a practical demonstrator application, we exemplify the proposed approach on a publication corpus from machine learning. We observe that our trajectory visualizations of 30 top machine learning venues and 1000 major authors in this field are well interpretable and are consistent with background knowledge drawn from the entities' publications. Next to producing interactive, interpr. visualizations supporting different kinds of analyses, our computed trajectories are suitable for trajectory mining applications in the future.