 Add to Chrome
 Add to Firefox
 Add to Edge
Community Detection on Model Explanation Graphs for Explainable AI
Oct 31, 2025Feature-attribution methods (e.g., SHAP, LIME) explain individual predictions but often miss higher-order structure: sets of features that act in concert. We propose Modules of Influence (MoI), a framework that (i) constructs a model explanation graph from per-instance attributions, (ii) applies community detection to find feature modules that jointly affect predictions, and (iii) quantifies how these modules relate to bias, redundancy, and causality patterns. Across synthetic and real datasets, MoI uncovers correlated feature groups, improves model debugging via module-level ablations, and localizes bias exposure to specific modules. We release stability and synergy metrics, a reference implementation, and evaluation protocols to benchmark module discovery in XAI.
BigGraphVis: Leveraging Streaming Algorithms and GPU Acceleration for Visualizing Big Graphs
Aug 01, 2021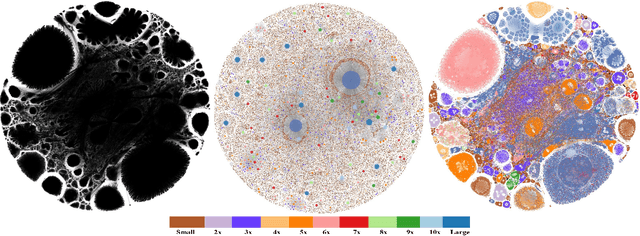
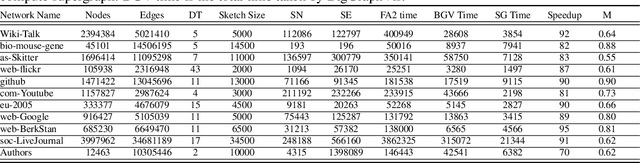
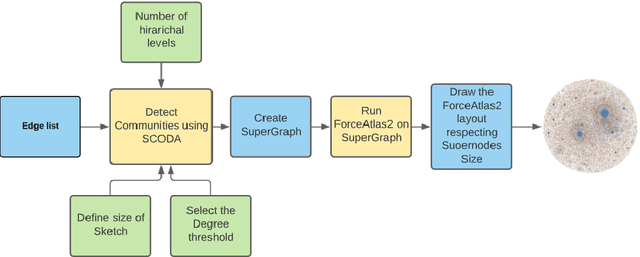
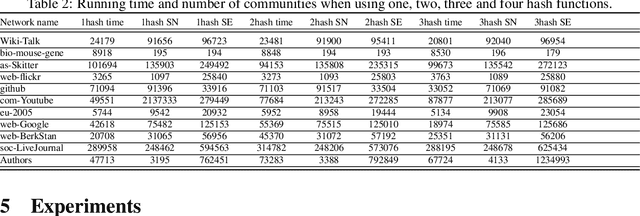
Graph layouts are key to exploring massive graphs. An enormous number of nodes and edges do not allow network analysis software to produce meaningful visualization of the pervasive networks. Long computation time, memory and display limitations encircle the software's ability to explore massive graphs. This paper introduces BigGraphVis, a new parallel graph visualization method that uses GPU parallel processing and community detection algorithm to visualize graph communities. We combine parallelized streaming community detection algorithm and probabilistic data structure to leverage parallel processing of Graphics Processing Unit (GPU). To the best of our knowledge, this is the first attempt to combine the power of streaming algorithms coupled with GPU computing to tackle big graph visualization challenges. Our method extracts community information in a few passes on the edge list, and renders the community structures using the ForceAtlas2 algorithm. Our experiment with massive real-life graphs indicates that about 70 to 95 percent speedup can be achieved by visualizing graph communities, and the visualization appears to be meaningful and reliable. The biggest graph that we examined contains above 3 million nodes and 34 million edges, and the layout computation took about five minutes. We also observed that the BigGraphVis coloring strategy can be successfully applied to produce a more informative ForceAtlas2 layout.