 Add to Chrome
 Add to Firefox
 Add to Edge
LangLasso: Interactive Cluster Descriptions through LLM Explanation
Jan 15, 2026Dimensionality reduction is a powerful technique for revealing structure and potential clusters in data. However, as the axes are complex, non-linear combinations of features, they often lack semantic interpretability. Existing visual analytics (VA) methods support cluster interpretation through feature comparison and interactive exploration, but they require technical expertise and intense human effort. We present \textit{LangLasso}, a novel method that complements VA approaches through interactive, natural language descriptions of clusters using large language models (LLMs). It produces human-readable descriptions that make cluster interpretation accessible to non-experts and allow integration of external contextual knowledge beyond the dataset. We systematically evaluate the reliability of these explanations and demonstrate that \langlasso provides an effective first step for engaging broader audiences in cluster interpretation. The tool is available at https://langlasso.vercel.app
Cluster-Based Random Forest Visualization and Interpretation
Jul 30, 2025


Random forests are a machine learning method used to automatically classify datasets and consist of a multitude of decision trees. While these random forests often have higher performance and generalize better than a single decision tree, they are also harder to interpret. This paper presents a visualization method and system to increase interpretability of random forests. We cluster similar trees which enables users to interpret how the model performs in general without needing to analyze each individual decision tree in detail, or interpret an oversimplified summary of the full forest. To meaningfully cluster the decision trees, we introduce a new distance metric that takes into account both the decision rules as well as the predictions of a pair of decision trees. We also propose two new visualization methods that visualize both clustered and individual decision trees: (1) The Feature Plot, which visualizes the topological position of features in the decision trees, and (2) the Rule Plot, which visualizes the decision rules of the decision trees. We demonstrate the efficacy of our approach through a case study on the "Glass" dataset, which is a relatively complex standard machine learning dataset, as well as a small user study.
Instance-Level Explanations for Fraud Detection: A Case Study
Jun 19, 2018


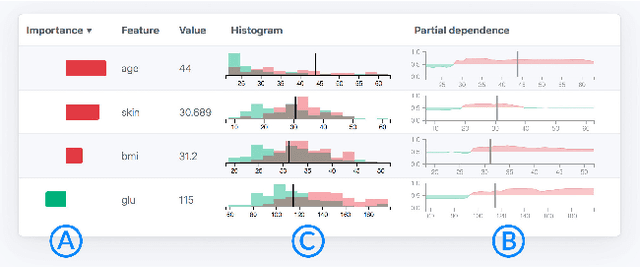
Fraud detection is a difficult problem that can benefit from predictive modeling. However, the verification of a prediction is challenging; for a single insurance policy, the model only provides a prediction score. We present a case study where we reflect on different instance-level model explanation techniques to aid a fraud detection team in their work. To this end, we designed two novel dashboards combining various state-of-the-art explanation techniques. These enable the domain expert to analyze and understand predictions, dramatically speeding up the process of filtering potential fraud cases. Finally, we discuss the lessons learned and outline open research issues.