 Add to Chrome
 Add to Firefox
 Add to Edge
New allometric models for the USA create a step-change in forest carbon estimation, modeling, and mapping
May 07, 2024The United States national forest inventory (NFI) serves as the foundation for forest aboveground biomass (AGB) and carbon accounting across the nation. These data enable design-based estimates of forest carbon stocks and stock-changes at state and regional levels, but also serve as inputs to model-based approaches for characterizing forest carbon stocks and stock-changes at finer resolutions. Although NFI tree and plot-level data are often treated as truth in these models, they are in fact estimates based on regional species-group models known collectively as the Component Ratio Method (CRM). In late 2023 the Forest Inventory and Analysis (FIA) program introduced a new National Scale Volume and Biomass Estimators (NSVB) system to replace CRM nationwide and offer more precise and accurate representations of forest AGB and carbon. Given the prevalence of model-based AGB studies relying on FIA, there is concern about the transferability of methods from CRM to NSVB models, as well as the comparability of existing CRM AGB products (e.g. maps) to new and forthcoming NSVB AGB products. To begin addressing these concerns we compared previously published CRM AGB maps to new maps produced using identical methods with NSVB AGB reference data. Our results suggest that models relying on passive satellite imagery (e.g. Landsat) provide acceptable estimates of point-in-time NSVB AGB and carbon stocks, but fail to accurately quantify growth in mature closed-canopy forests. We highlight that existing estimates, models, and maps based on FIA reference data are no longer compatible with NSVB, and recommend new methods as well as updated models and maps for accommodating this step-change. Our collective ability to adopt NSVB in our modeling and mapping workflows will help us provide the most accurate spatial forest carbon data possible in order to better inform local management and decision making.
Mapping historical forest biomass for stock-change assessments at parcel to landscape scales
Apr 05, 2023Understanding historical forest dynamics, specifically changes in forest biomass and carbon stocks, has become critical for assessing current forest climate benefits and projecting future benefits under various policy, regulatory, and stewardship scenarios. Carbon accounting frameworks based exclusively on national forest inventories are limited to broad-scale estimates, but model-based approaches that combine these inventories with remotely sensed data can yield contiguous fine-resolution maps of forest biomass and carbon stocks across landscapes over time. Here we describe a fundamental step in building a map-based stock-change framework: mapping historical forest biomass at fine temporal and spatial resolution (annual, 30m) across all of New York State (USA) from 1990 to 2019, using freely available data and open-source tools. Using Landsat imagery, US Forest Service Forest Inventory and Analysis (FIA) data, and off-the-shelf LiDAR collections we developed three modeling approaches for mapping historical forest aboveground biomass (AGB): training on FIA plot-level AGB estimates (direct), training on LiDAR-derived AGB maps (indirect), and an ensemble averaging predictions from the direct and indirect models. Model prediction surfaces (maps) were tested against FIA estimates at multiple scales. All three approaches produced viable outputs, yet tradeoffs were evident in terms of model complexity, map accuracy, saturation, and fine-scale pattern representation. The resulting map products can help identify where, when, and how forest carbon stocks are changing as a result of both anthropogenic and natural drivers alike. These products can thus serve as inputs to a wide range of applications including stock-change assessments, monitoring reporting and verification frameworks, and prioritizing parcels for protection or enrollment in improved management programs.
High-resolution landscape-scale biomass mapping using a spatiotemporal patchwork of LiDAR coverages
May 17, 2022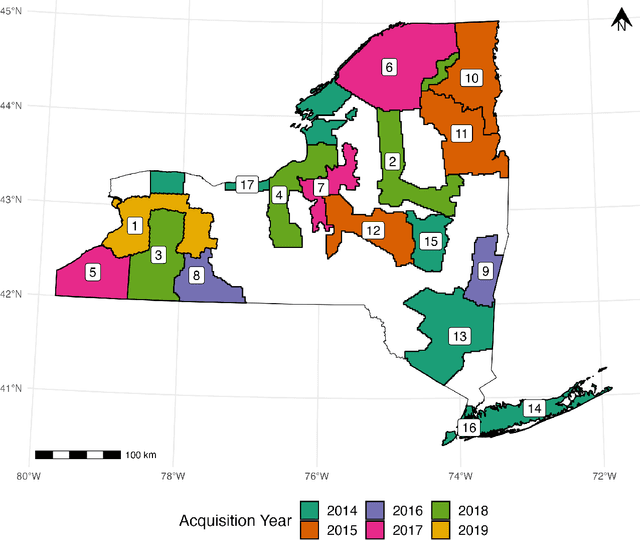
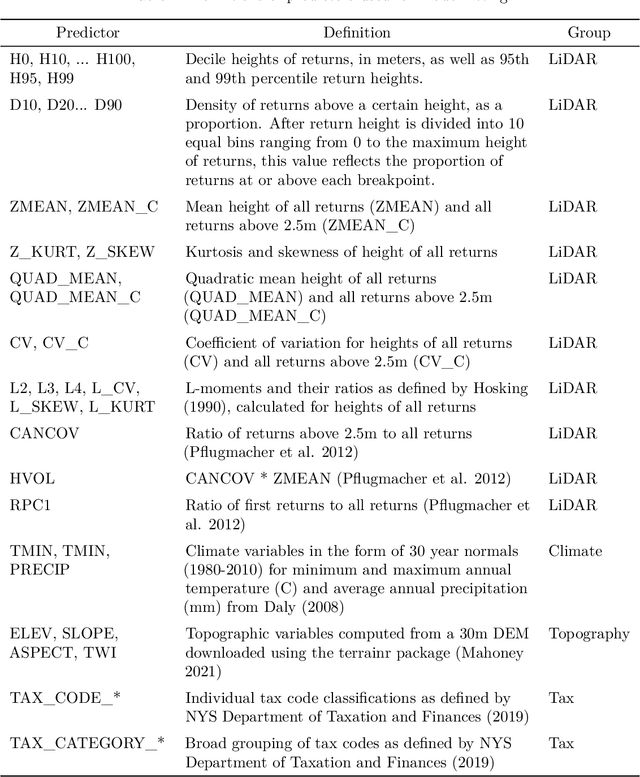
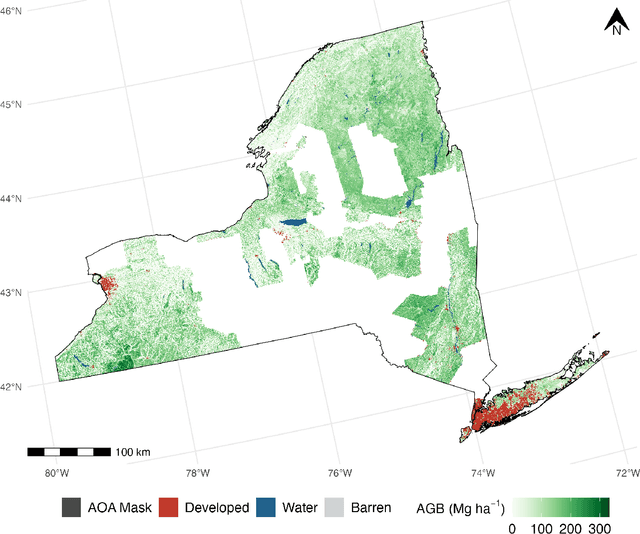
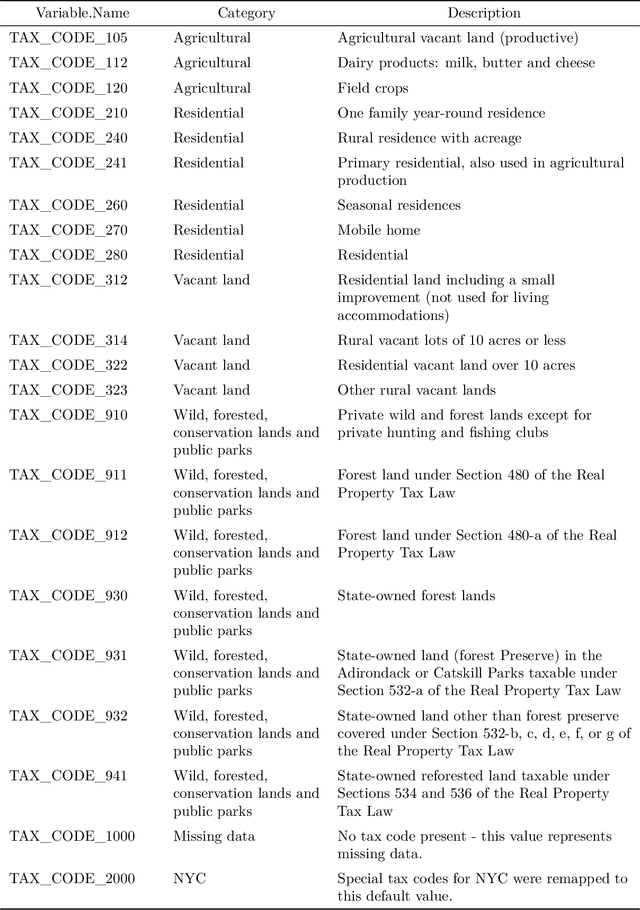
Estimating forest aboveground biomass at fine spatial scales has become increasingly important for greenhouse gas estimation, monitoring, and verification efforts to mitigate climate change. Airborne LiDAR continues to be a valuable source of remote sensing data for estimating aboveground biomass. However airborne LiDAR collections may take place at local or regional scales covering irregular, non-contiguous footprints, resulting in a 'patchwork' of different landscape segments at different points in time. Here we addressed common obstacles including selection of training data, the investigation of regional or coverage specific patterns in bias and error, and map agreement, and model-based precision assessments at multiple scales. Three machine learning algorithms and an ensemble model were trained using field inventory data (FIA), airborne LiDAR, and topographic, climatic and cadastral geodata. Using strict selection criteria, 801 FIA plots were selected with co-located point clouds drawn from a patchwork of 17 leaf-off LiDAR coverages 2014-2019). Our ensemble model created 30m AGB prediction surfaces within a predictor-defined area of applicability (98% of LiDAR coverage) and resulting AGB predictions were compared with FIA plot-level and areal estimates at multiple scales of aggregation. Our model was overall accurate (% RMSE 13-33%), had very low bias (MBE $\leq$ $\pm$5 Mg ha$^{-1}$), explained most field-observed variation (R$^2$ 0.74-0.93), produced estimates that were both largely consistent with FIA's aggregate summaries (86% of estimates within 95% CI), as well as precise when aggregated to arbitrary small-areas (mean bootstrap standard error 0.37 Mg ha$^{-1}$). We share practical solutions to challenges faced when using spatiotemporal patchworks of LiDAR to meet growing needs for biomass prediction and mapping, and applications in carbon accounting and ecosystem stewardship.