 Add to Chrome
 Add to Firefox
 Add to Edge
AI-Driven Real-Time Monitoring of Ground-Nesting Birds: A Case Study on Curlew Detection Using YOLOv10
Nov 22, 2024


Effective monitoring of wildlife is critical for assessing biodiversity and ecosystem health, as declines in key species often signal significant environmental changes. Birds, particularly ground-nesting species, serve as important ecological indicators due to their sensitivity to environmental pressures. Camera traps have become indispensable tools for monitoring nesting bird populations, enabling data collection across diverse habitats. However, the manual processing and analysis of such data are resource-intensive, often delaying the delivery of actionable conservation insights. This study presents an AI-driven approach for real-time species detection, focusing on the curlew (Numenius arquata), a ground-nesting bird experiencing significant population declines. A custom-trained YOLOv10 model was developed to detect and classify curlews and their chicks using 3/4G-enabled cameras linked to the Conservation AI platform. The system processes camera trap data in real-time, significantly enhancing monitoring efficiency. Across 11 nesting sites in Wales, the model achieved high performance, with a sensitivity of 90.56%, specificity of 100%, and F1-score of 95.05% for curlew detections, and a sensitivity of 92.35%, specificity of 100%, and F1-score of 96.03% for curlew chick detections. These results demonstrate the capability of AI-driven monitoring systems to deliver accurate, timely data for biodiversity assessments, facilitating early conservation interventions and advancing the use of technology in ecological research.
Towards Context-Rich Automated Biodiversity Assessments: Deriving AI-Powered Insights from Camera Trap Data
Nov 21, 2024


Camera traps offer enormous new opportunities in ecological studies, but current automated image analysis methods often lack the contextual richness needed to support impactful conservation outcomes. Here we present an integrated approach that combines deep learning-based vision and language models to improve ecological reporting using data from camera traps. We introduce a two-stage system: YOLOv10-X to localise and classify species (mammals and birds) within images, and a Phi-3.5-vision-instruct model to read YOLOv10-X binding box labels to identify species, overcoming its limitation with hard to classify objects in images. Additionally, Phi-3.5 detects broader variables, such as vegetation type, and time of day, providing rich ecological and environmental context to YOLO's species detection output. When combined, this output is processed by the model's natural language system to answer complex queries, and retrieval-augmented generation (RAG) is employed to enrich responses with external information, like species weight and IUCN status (information that cannot be obtained through direct visual analysis). This information is used to automatically generate structured reports, providing biodiversity stakeholders with deeper insights into, for example, species abundance, distribution, animal behaviour, and habitat selection. Our approach delivers contextually rich narratives that aid in wildlife management decisions. By providing contextually rich insights, our approach not only reduces manual effort but also supports timely decision-making in conservation, potentially shifting efforts from reactive to proactive management.
Removing Human Bottlenecks in Bird Classification Using Camera Trap Images and Deep Learning
May 03, 2023


Birds are important indicators for monitoring both biodiversity and habitat health; they also play a crucial role in ecosystem management. Decline in bird populations can result in reduced eco-system services, including seed dispersal, pollination and pest control. Accurate and long-term monitoring of birds to identify species of concern while measuring the success of conservation interventions is essential for ecologists. However, monitoring is time consuming, costly and often difficult to manage over long durations and at meaningfully large spatial scales. Technology such as camera traps, acoustic monitors and drones provide methods for non-invasive monitoring. There are two main problems with using camera traps for monitoring: a) cameras generate many images, making it difficult to process and analyse the data in a timely manner; and b) the high proportion of false positives hinders the processing and analysis for reporting. In this paper, we outline an approach for overcoming these issues by utilising deep learning for real-time classi-fication of bird species and automated removal of false positives in camera trap data. Images are classified in real-time using a Faster-RCNN architecture. Images are transmitted over 3/4G cam-eras and processed using Graphical Processing Units (GPUs) to provide conservationists with key detection metrics therefore removing the requirement for manual observations. Our models achieved an average sensitivity of 88.79%, a specificity of 98.16% and accuracy of 96.71%. This demonstrates the effectiveness of using deep learning for automatic bird monitoring.
Empowering Wildlife Guardians: An Equitable Digital Stewardship and Reward System for Biodiversity Conservation using Deep Learning and 3/4G Camera Traps
Apr 25, 2023


The biodiversity of our planet is under threat, with approximately one million species expected to become extinct within decades. The reason; negative human actions, which include hunting, overfishing, pollution, and the conversion of land for urbanisation and agricultural purposes. Despite significant investment from charities and governments for activities that benefit nature, global wildlife populations continue to decline. Local wildlife guardians have historically played a critical role in global conservation efforts and have shown their ability to achieve sustainability at various levels. In 2021, COP26 recognised their contributions and pledged US$1.7 billion per year; however, this is a fraction of the global biodiversity budget available (between US$124 billion and US$143 billion annually) given they protect 80% of the planets biodiversity. This paper proposes a radical new solution based on "Interspecies Money," where animals own their own money. Creating a digital twin for each species allows animals to dispense funds to their guardians for the services they provide. For example, a rhinoceros may release a payment to its guardian each time it is detected in a camera trap as long as it remains alive and well. To test the efficacy of this approach 27 camera traps were deployed over a 400km2 area in Welgevonden Game Reserve in Limpopo Province in South Africa. The motion-triggered camera traps were operational for ten months and, using deep learning, we managed to capture images of 12 distinct animal species. For each species, a makeshift bank account was set up and credited with {\pounds}100. Each time an animal was captured in a camera and successfully classified, 1 penny (an arbitrary amount - mechanisms still need to be developed to determine the real value of species) was transferred from the animal account to its associated guardian.
Pressure Ulcer Categorisation using Deep Learning: A Clinical Trial to Evaluate Model Performance
Mar 07, 2022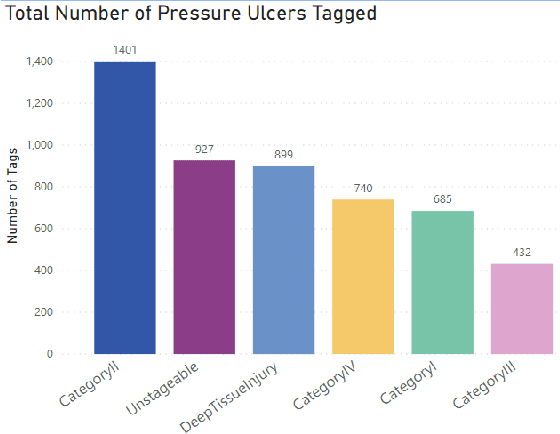
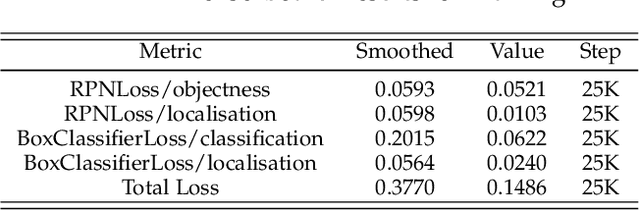
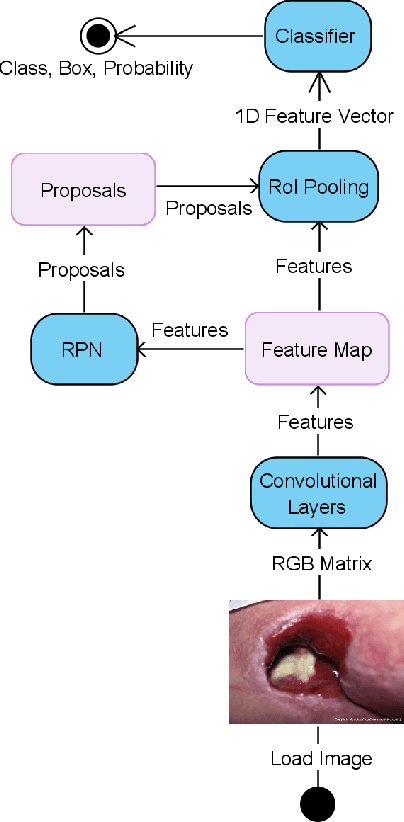
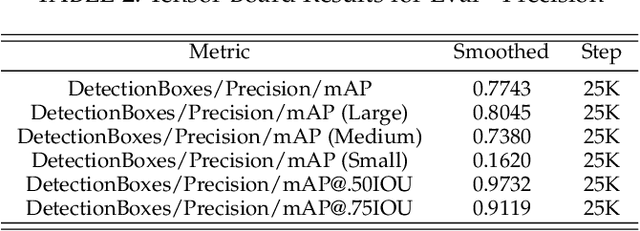
Pressure ulcers are a challenge for patients and healthcare professionals. In the UK, 700,000 people are affected by pressure ulcers each year. Treating them costs the National Health Service {\pounds}3.8 million every day. Their etiology is complex and multifactorial. However, evidence has shown a strong link between old age, disease-related sedentary lifestyles and unhealthy eating habits. Pressure ulcers are caused by direct skin contact with a bed or chair without frequent position changes. Urinary and faecal incontinence, diabetes, and injuries that restrict body position and nutrition are also known risk factors. Guidelines and treatments exist but their implementation and success vary across different healthcare settings. This is primarily because healthcare practitioners have a) minimal experience in dealing with pressure ulcers, and b) a general lack of understanding of pressure ulcer treatments. Poorly managed, pressure ulcers lead to severe pain, poor quality of life, and significant healthcare costs. In this paper, we report the findings of a clinical trial conducted by Mersey Care NHS Foundation Trust that evaluated the performance of a faster region-based convolutional neural network and mobile platform that categorised and documented pressure ulcers. The neural network classifies category I, II, III, and IV pressure ulcers, deep tissue injuries, and unstageable pressure ulcers. Photographs of pressure ulcers taken by district nurses are transmitted over 4/5G communications to an inferencing server for classification. Classified images are stored and reviewed to assess the model's predictions and relevance as a tool for clinical decision making and standardised reporting. The results from the study generated a mean average Precision=0.6796, Recall=0.6997, F1-Score=0.6786 with 45 false positives using an @.75 confidence score threshold.
Choosing an Appropriate Platform and Workflow for Processing Camera Trap Data using Artificial Intelligence
Feb 04, 2022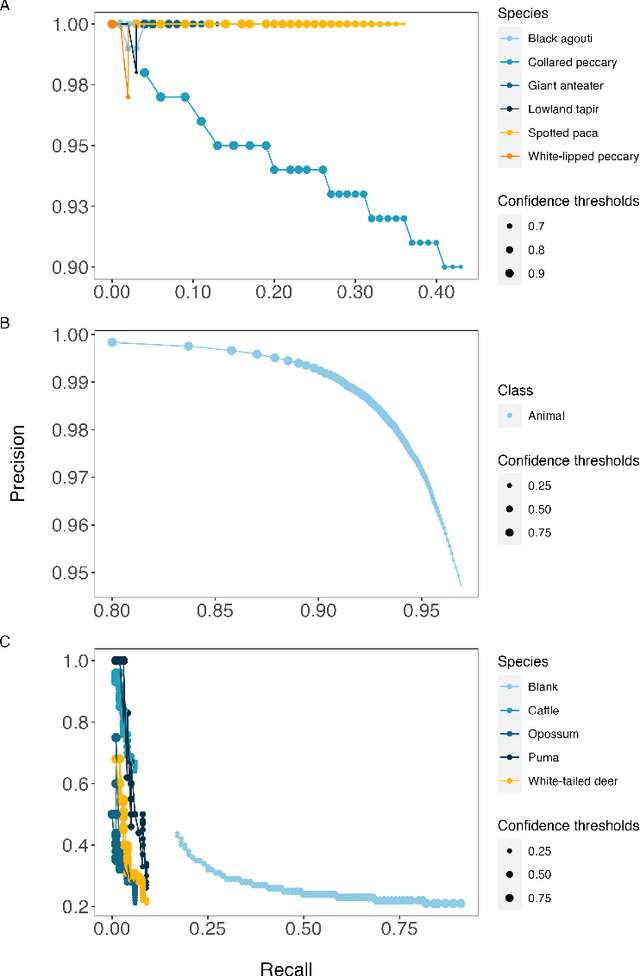
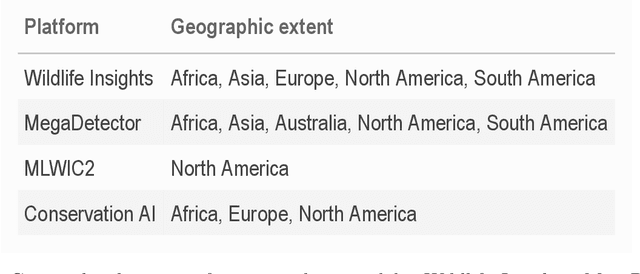
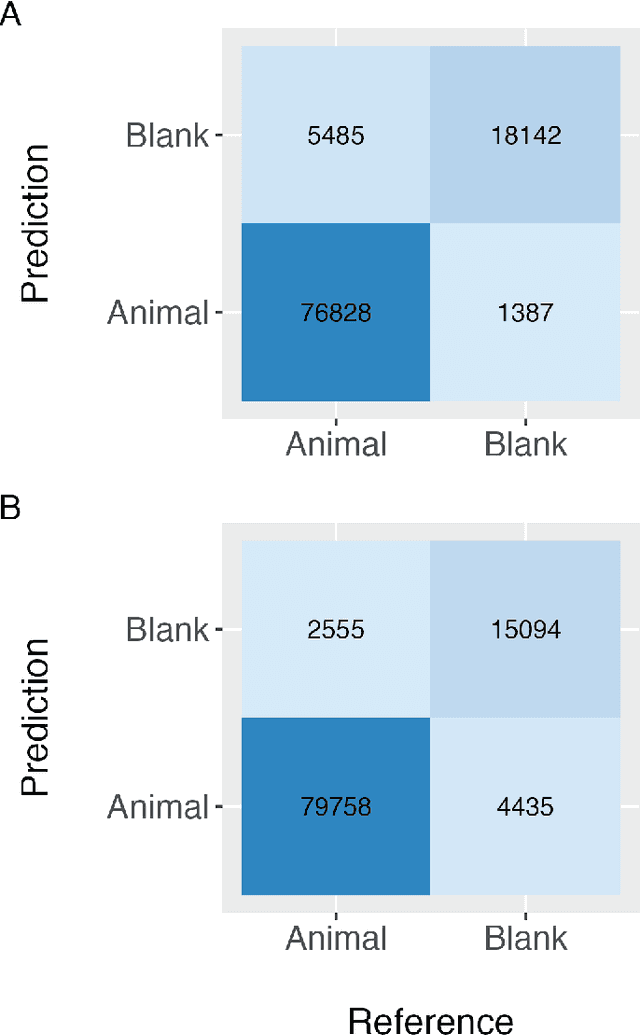
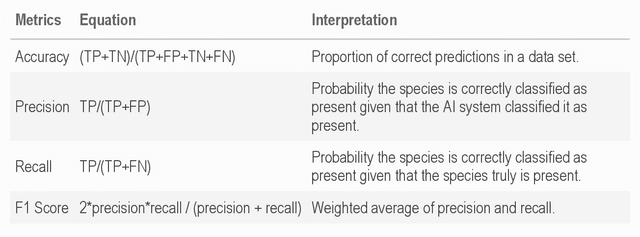
Camera traps have transformed how ecologists study wildlife species distributions, activity patterns, and interspecific interactions. Although camera traps provide a cost-effective method for monitoring species, the time required for data processing can limit survey efficiency. Thus, the potential of Artificial Intelligence (AI), specifically Deep Learning (DL), to process camera-trap data has gained considerable attention. Using DL for these applications involves training algorithms, such as Convolutional Neural Networks (CNNs), to automatically detect objects and classify species. To overcome technical challenges associated with training CNNs, several research communities have recently developed platforms that incorporate DL in easy-to-use interfaces. We review key characteristics of four AI-powered platforms -- Wildlife Insights (WI), MegaDetector (MD), Machine Learning for Wildlife Image Classification (MLWIC2), and Conservation AI -- including data management tools and AI features. We also provide R code in an open-source GitBook, to demonstrate how users can evaluate model performance, and incorporate AI output in semi-automated workflows. We found that species classifications from WI and MLWIC2 generally had low recall values (animals that were present in the images often were not classified to the correct species). Yet, the precision of WI and MLWIC2 classifications for some species was high (i.e., when classifications were made, they were generally accurate). MD, which classifies images using broader categories (e.g., "blank" or "animal"), also performed well. Thus, we conclude that, although species classifiers were not accurate enough to automate image processing, DL could be used to improve efficiencies by accepting classifications with high confidence values for certain species or by filtering images containing blanks.
Real-Time Predictive Maintenance using Autoencoder Reconstruction and Anomaly Detection
Oct 01, 2021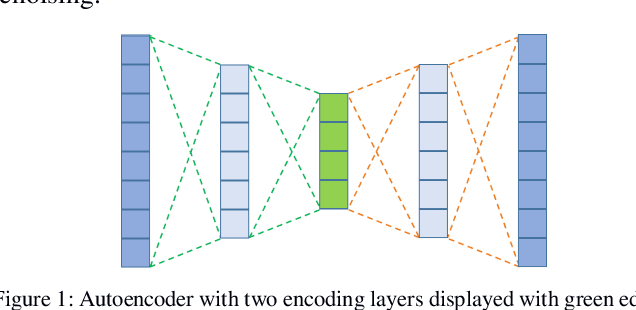
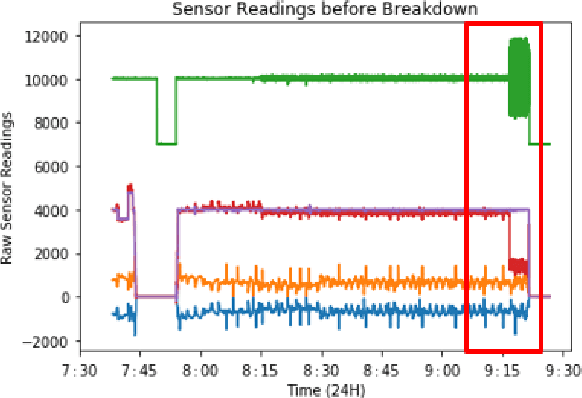
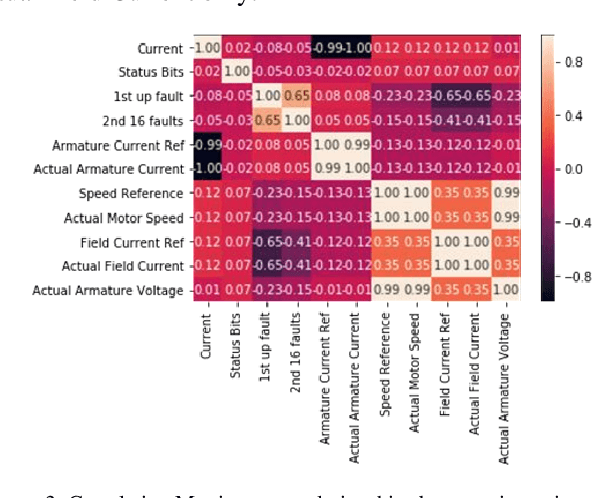
Rotary machine breakdown detection systems are outdated and dependent upon routine testing to discover faults. This is costly and often reactive in nature. Real-time monitoring offers a solution for detecting faults without the need for manual observation. However, manual interpretation for threshold anomaly detection is often subjective and varies between industrial experts. This approach is ridged and prone to a large number of false positives. To address this issue, we propose a Machine Learning (ML) approach to model normal working operation and detect anomalies. The approach extracts key features from signals representing known normal operation to model machine behaviour and automatically identify anomalies. The ML learns generalisations and generates thresholds based on fault severity. This provides engineers with a traffic light system were green is normal behaviour, amber is worrying and red signifies a machine fault. This scale allows engineers to undertake early intervention measures at the appropriate time. The approach is evaluated on windowed real machine sensor data to observe normal and abnormal behaviour. The results demonstrate that it is possible to detect anomalies within the amber range and raise alarms before machine failure.
Detection of Obstructive Sleep Apnoea Using Features Extracted from Segmented Time-Series ECG Signals Using a One Dimensional Convolutional Neural Network
Feb 03, 2020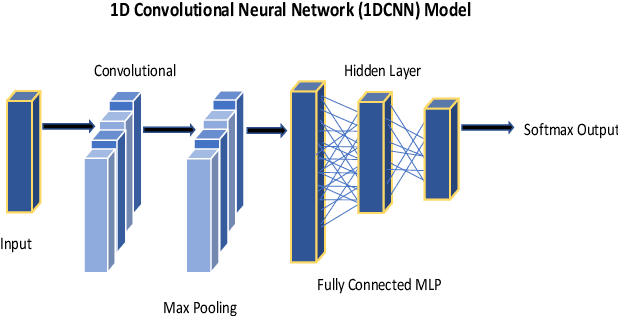
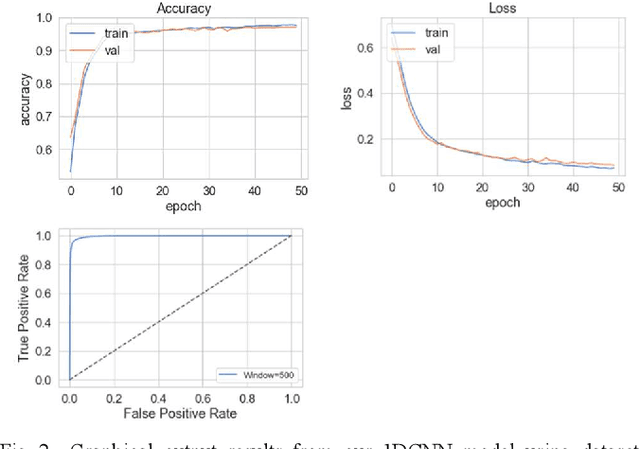
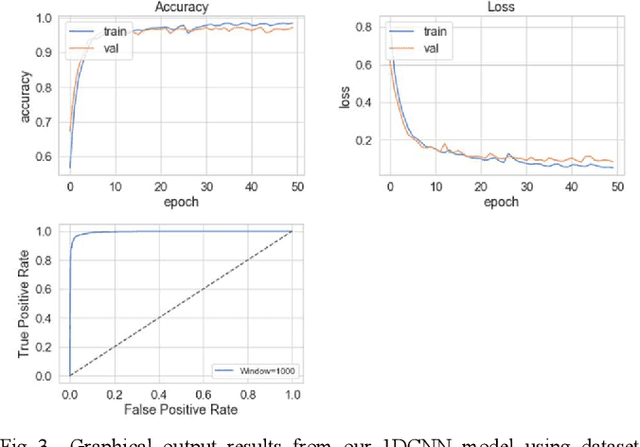
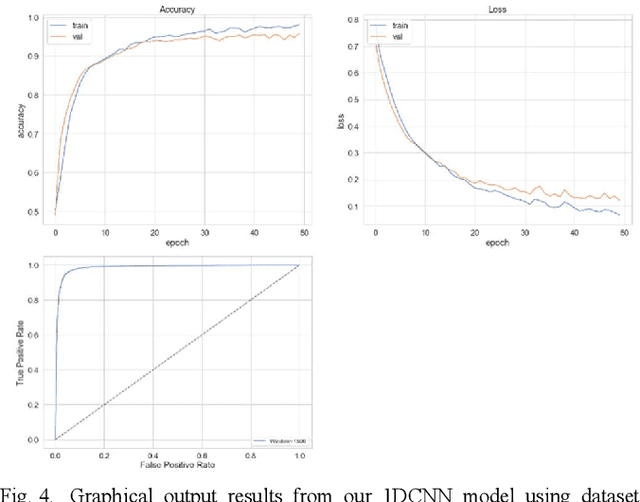
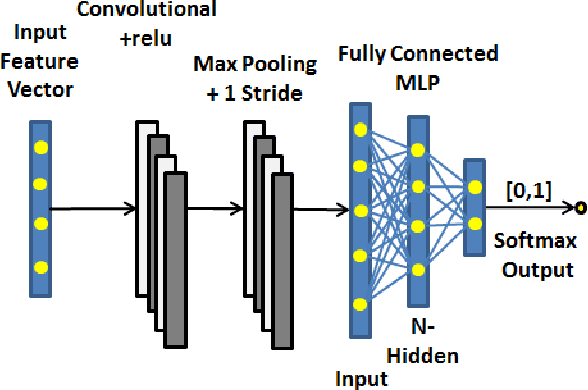
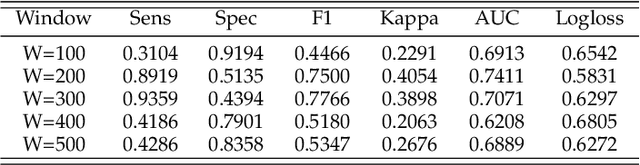
The study in this paper presents a one-dimensional convolutional neural network (1DCNN) model, designed for the automated detection of obstructive Sleep Apnoea (OSA) captured from single-channel electrocardiogram (ECG) signals. The system provides mechanisms in clinical practice that help diagnose patients suffering with OSA. Using the state-of-the-art in 1DCNNs, a model is constructed using convolutional, max pooling layers and a fully connected Multilayer Perceptron (MLP) consisting of a hidden layer and SoftMax output for classification. The 1DCNN extracts prominent features, which are used to train an MLP. The model is trained using segmented ECG signals grouped into 5 unique datasets of set window sizes. 35 ECG signal recordings were selected from an annotated database containing 70 night-time ECG recordings. (Group A = a01 to a20 (Apnoea breathing), Group B = b01 to b05 (moderate), and Group C = c01 to c10 (normal). A total of 6514 minutes of Apnoea was recorded. Evaluation of the model is performed using a set of standard metrics which show the proposed model achieves high classification results in both training and validation using our windowing strategy, particularly W=500 (Sensitivity 0.9705, Specificity 0.9725, F1 Score 0.9717, Kappa Score 0.9430, Log Loss 0.0836, ROCAUC 0.9945). This demonstrates the model can identify the presence of Apnoea with a high degree of accuracy.
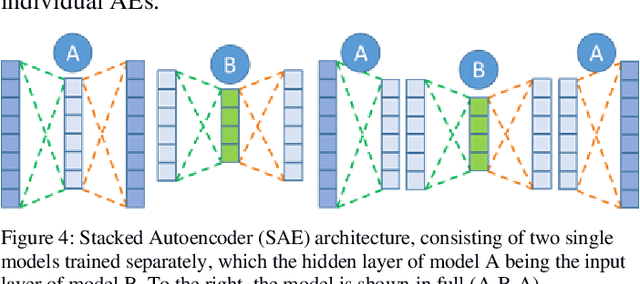
SAERMA: Stacked Autoencoder Rule Mining Algorithm for the Interpretation of Epistatic Interactions in GWAS for Extreme Obesity
Aug 27, 2019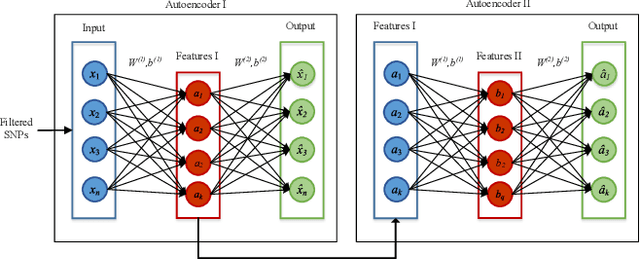
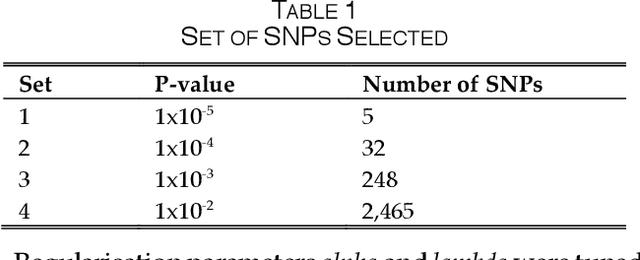
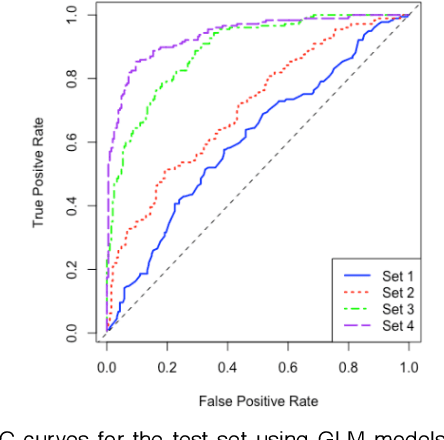
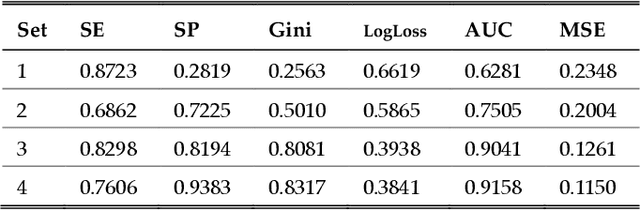
One of the most important challenges in the analysis of high-throughput genetic data is the development of efficient computational methods to identify statistically significant Single Nucleotide Polymorphisms (SNPs). Genome-wide association studies (GWAS) use single-locus analysis where each SNP is independently tested for association with phenotypes. The limitation with this approach, however, is its inability to explain genetic variation in complex diseases. Alternative approaches are required to model the intricate relationships between SNPs. Our proposed approach extends GWAS by combining deep learning stacked autoencoders (SAEs) and association rule mining (ARM) to identify epistatic interactions between SNPs. Following traditional GWAS quality control and association analysis, the most significant SNPs are selected and used in the subsequent analysis to investigate epistasis. SAERMA controls the classification results produced in the final fully connected multi-layer feedforward artificial neural network (MLP) by manipulating the interestingness measures, support and confidence, in the rule generation process. The best classification results were achieved with 204 SNPs compressed to 100 units (77% AUC, 77% SE, 68% SP, 53% Gini, logloss=0.58, and MSE=0.20), although it was possible to achieve 73% AUC (77% SE, 63% SP, 45% Gini, logloss=0.62, and MSE=0.21) with 50 hidden units - both supported by close model interpretation.
Modelling Segmented Cardiotocography Time-Series Signals Using One-Dimensional Convolutional Neural Networks for the Early Detection of Abnormal Birth Outcomes
Aug 06, 2019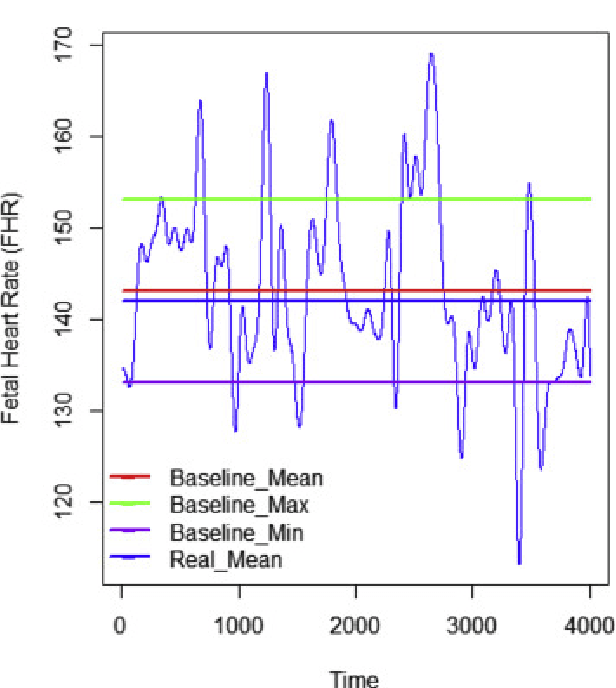
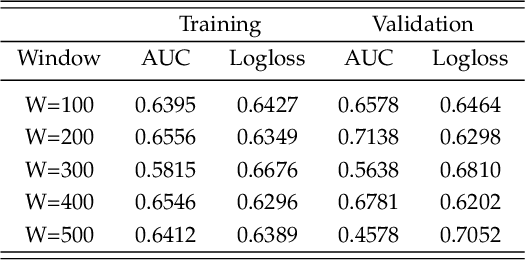
Gynaecologists and obstetricians visually interpret cardiotocography (CTG) traces using the International Federation of Gynaecology and Obstetrics (FIGO) guidelines to assess the wellbeing of the foetus during antenatal care. This approach has raised concerns among professionals concerning inter- and intra-variability where clinical diagnosis only has a 30% positive predictive value when classifying pathological outcomes. Machine learning models, trained with FIGO and other user derived features extracted from CTG traces, have been shown to increase positive predictive capacity and minimise variability. This is only possible however when class distributions are equal which is rarely the case in clinical trials where case-control observations are heavily skewed. Classes can be balanced using either synthetic data derived from resampled case training data or by decreasing the number of control instances. However, this introduces bias and removes valuable information. Concerns have also been raised regarding machine learning studies and their reliance on manually handcrafted features. While this has led to some interesting results, deriving an optimal set of features is considered to be an art as well as a science and is often an empirical and time consuming process. In this paper, we address both of these issues and propose a novel CTG analysis methodology that a) splits CTG time series signals into n-size windows with equal class distributions, and b) automatically extracts features from time-series windows using a one dimensional convolutional neural network (1DCNN) and multilayer perceptron (MLP) ensemble. Our proposed method achieved good results using a window size of 200 with (Sens=0.7981, Spec=0.7881, F1=0.7830, Kappa=0.5849, AUC=0.8599, and Logloss=0.4791).