 Add to Chrome
 Add to Firefox
 Add to Edge
Real Time Analytics: Algorithms and Systems
Aug 07, 2017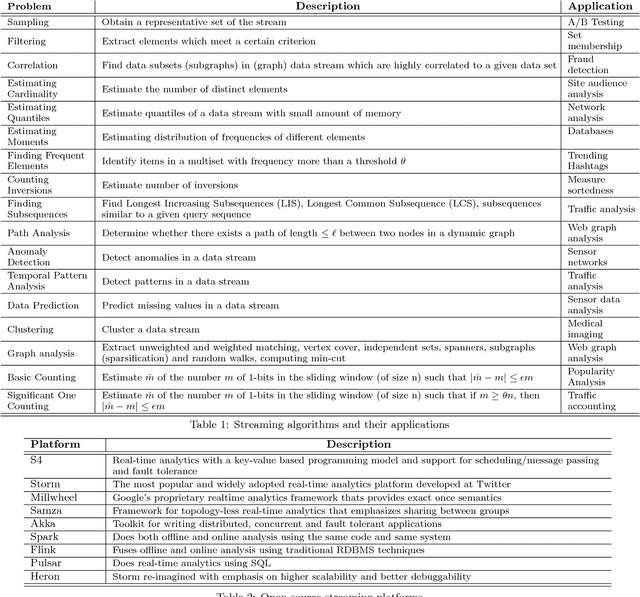
Velocity is one of the 4 Vs commonly used to characterize Big Data. In this regard, Forrester remarked the following in Q3 2014: "The high velocity, white-water flow of data from innumerable real-time data sources such as market data, Internet of Things, mobile, sensors, click-stream, and even transactions remain largely unnavigated by most firms. The opportunity to leverage streaming analytics has never been greater." Example use cases of streaming analytics include, but not limited to: (a) visualization of business metrics in real-time (b) facilitating highly personalized experiences (c) expediting response during emergencies. Streaming analytics is extensively used in a wide variety of domains such as healthcare, e-commerce, financial services, telecommunications, energy and utilities, manufacturing, government and transportation. In this tutorial, we shall present an in-depth overview of streaming analytics - applications, algorithms and platforms - landscape. We shall walk through how the field has evolved over the last decade and then discuss the current challenges - the impact of the other three Vs, viz., Volume, Variety and Veracity, on Big Data streaming analytics. The tutorial is intended for both researchers and practitioners in the industry. We shall also present state-of-the-affairs of streaming analytics at Twitter.
Automatic Anomaly Detection in the Cloud Via Statistical Learning
Apr 24, 2017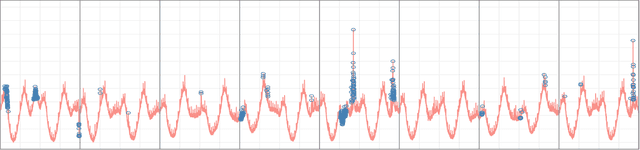
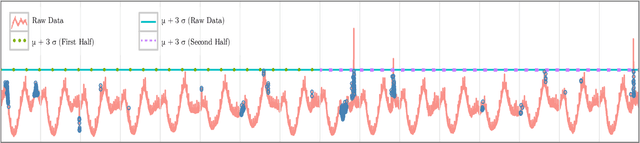
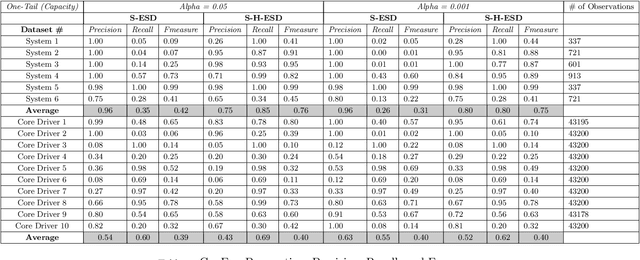
Performance and high availability have become increasingly important drivers, amongst other drivers, for user retention in the context of web services such as social networks, and web search. Exogenic and/or endogenic factors often give rise to anomalies, making it very challenging to maintain high availability, while also delivering high performance. Given that service-oriented architectures (SOA) typically have a large number of services, with each service having a large set of metrics, automatic detection of anomalies is non-trivial. Although there exists a large body of prior research in anomaly detection, existing techniques are not applicable in the context of social network data, owing to the inherent seasonal and trend components in the time series data. To this end, we developed two novel statistical techniques for automatically detecting anomalies in cloud infrastructure data. Specifically, the techniques employ statistical learning to detect anomalies in both application, and system metrics. Seasonal decomposition is employed to filter the trend and seasonal components of the time series, followed by the use of robust statistical metrics -- median and median absolute deviation (MAD) -- to accurately detect anomalies, even in the presence of seasonal spikes. We demonstrate the efficacy of the proposed techniques from three different perspectives, viz., capacity planning, user behavior, and supervised learning. In particular, we used production data for evaluation, and we report Precision, Recall, and F-measure in each case.