 Add to Chrome
 Add to Firefox
 Add to Edge
Near-optimal-sample estimators for spherical Gaussian mixtures
Feb 19, 2014Statistical and machine-learning algorithms are frequently applied to high-dimensional data. In many of these applications data is scarce, and often much more costly than computation time. We provide the first sample-efficient polynomial-time estimator for high-dimensional spherical Gaussian mixtures. For mixtures of any $k$ $d$-dimensional spherical Gaussians, we derive an intuitive spectral-estimator that uses $\mathcal{O}_k\bigl(\frac{d\log^2d}{\epsilon^4}\bigr)$ samples and runs in time $\mathcal{O}_{k,\epsilon}(d^3\log^5 d)$, both significantly lower than previously known. The constant factor $\mathcal{O}_k$ is polynomial for sample complexity and is exponential for the time complexity, again much smaller than what was previously known. We also show that $\Omega_k\bigl(\frac{d}{\epsilon^2}\bigr)$ samples are needed for any algorithm. Hence the sample complexity is near-optimal in the number of dimensions. We also derive a simple estimator for one-dimensional mixtures that uses $\mathcal{O}\bigl(\frac{k \log \frac{k}{\epsilon} }{\epsilon^2} \bigr)$ samples and runs in time $\widetilde{\mathcal{O}}\left(\bigl(\frac{k}{\epsilon}\bigr)^{3k+1}\right)$. Our other technical contributions include a faster algorithm for choosing a density estimate from a set of distributions, that minimizes the $\ell_1$ distance to an unknown underlying distribution.
On Modeling Profiles instead of Values
Jul 11, 2012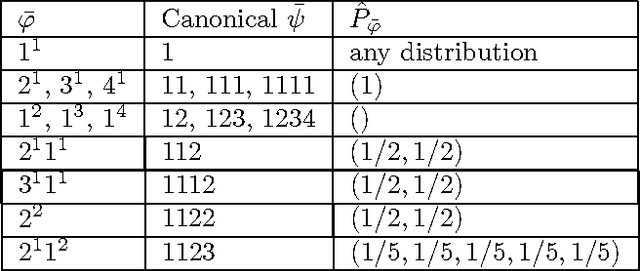
We consider the problem of estimating the distribution underlying an observed sample of data. Instead of maximum likelihood, which maximizes the probability of the ob served values, we propose a different estimate, the high-profile distribution, which maximizes the probability of the observed profile the number of symbols appearing any given number of times. We determine the high-profile distribution of several data samples, establish some of its general properties, and show that when the number of distinct symbols observed is small compared to the data size, the high-profile and maximum-likelihood distributions are roughly the same, but when the number of symbols is large, the distributions differ, and high-profile better explains the data.