 Add to Chrome
 Add to Firefox
 Add to Edge
Self-supervised vision-langage alignment of deep learning representations for bone X-rays analysis
May 14, 2024


This paper proposes leveraging vision-language pretraining on bone X-rays paired with French reports to address downstream tasks of interest on bone radiography. A practical processing pipeline is introduced to anonymize and process French medical reports. Pretraining then consists in the self-supervised alignment of visual and textual embedding spaces derived from deep model encoders. The resulting image encoder is then used to handle various downstream tasks, including quantification of osteoarthritis, estimation of bone age on pediatric wrists, bone fracture and anomaly detection. Our approach demonstrates competitive performance on downstream tasks, compared to alternatives requiring a significantly larger amount of human expert annotations. Our work stands as the first study to integrate French reports to shape the embedding space devoted to bone X-Rays representations, capitalizing on the large quantity of paired images and reports data available in an hospital. By relying on generic vision-laguage deep models in a language-specific scenario, it contributes to the deployement of vision models for wider healthcare applications.
An Experimental Investigation into the Evaluation of Explainability Methods
May 25, 2023EXplainable Artificial Intelligence (XAI) aims to help users to grasp the reasoning behind the predictions of an Artificial Intelligence (AI) system. Many XAI approaches have emerged in recent years. Consequently, a subfield related to the evaluation of XAI methods has gained considerable attention, with the aim to determine which methods provide the best explanation using various approaches and criteria. However, the literature lacks a comparison of the evaluation metrics themselves, that one can use to evaluate XAI methods. This work aims to fill this gap by comparing 14 different metrics when applied to nine state-of-the-art XAI methods and three dummy methods (e.g., random saliency maps) used as references. Experimental results show which of these metrics produces highly correlated results, indicating potential redundancy. We also demonstrate the significant impact of varying the baseline hyperparameter on the evaluation metric values. Finally, we use dummy methods to assess the reliability of metrics in terms of ranking, pointing out their limitations.
Poly-CAM: High resolution class activation map for convolutional neural networks
May 05, 2022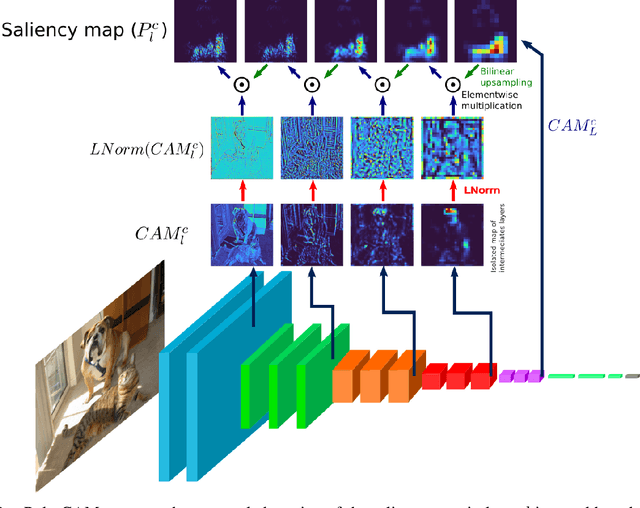
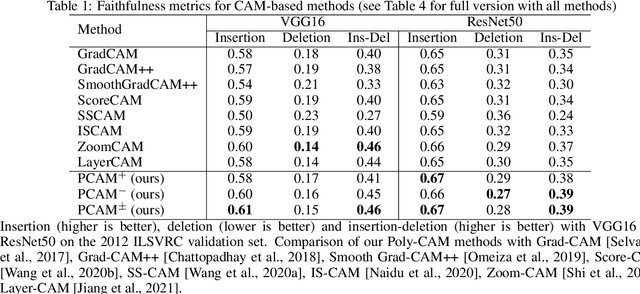
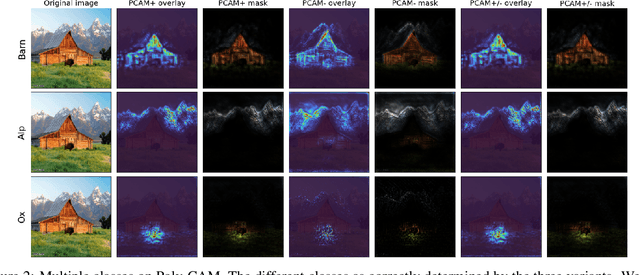
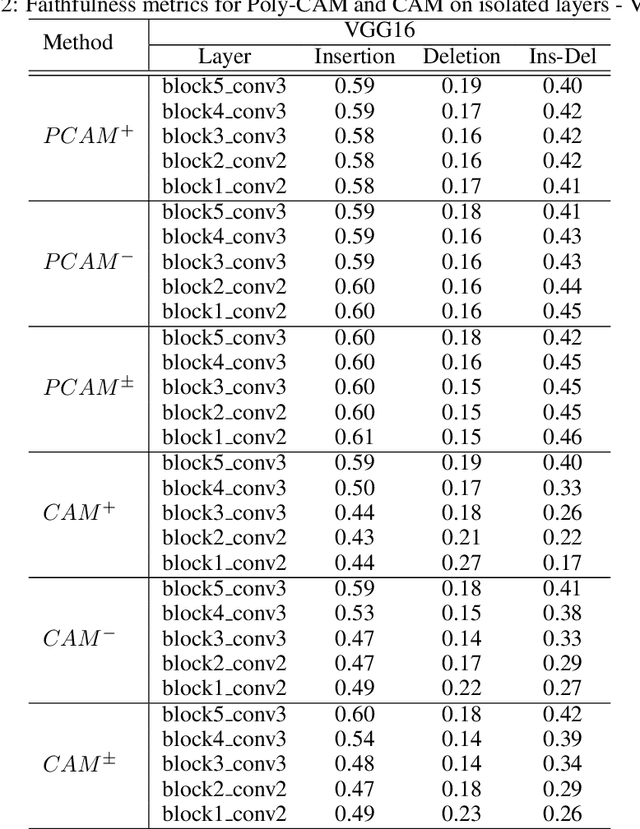
The need for Explainable AI is increasing with the development of deep learning. The saliency maps derived from convolutional neural networks generally fail in localizing with accuracy the image features justifying the network prediction. This is because those maps are either low-resolution as for CAM [Zhou et al., 2016], or smooth as for perturbation-based methods [Zeiler and Fergus, 2014], or do correspond to a large number of widespread peaky spots as for gradient-based approaches [Sundararajan et al., 2017, Smilkov et al., 2017]. In contrast, our work proposes to combine the information from earlier network layers with the one from later layers to produce a high resolution Class Activation Map that is competitive with the previous art in term of insertion-deletion faithfulness metrics, while outperforming it in term of precision of class-specific features localization.