 Add to Chrome
 Add to Firefox
 Add to Edge
WISE: A Multimodal Search Engine for Visual Scenes, Audio, Objects, Faces, Speech, and Metadata
Feb 13, 2026In this paper, we present WISE, an open-source audiovisual search engine which integrates a range of multimodal retrieval capabilities into a single, practical tool accessible to users without machine learning expertise. WISE supports natural-language and reverse-image queries at both the scene level (e.g. empty street) and object level (e.g. horse) across images and videos; face-based search for specific individuals; audio retrieval of acoustic events using text (e.g. wood creak) or an audio file; search over automatically transcribed speech; and filtering by user-provided metadata. Rich insights can be obtained by combining queries across modalities -- for example, retrieving German trains from a historical archive by applying the object query "train" and the metadata query "Germany", or searching for a face in a place. By employing vector search techniques, WISE can scale to support efficient retrieval over millions of images or thousands of hours of video. Its modular architecture facilitates the integration of new models. WISE can be deployed locally for private or sensitive collections, and has been applied to various real-world use cases. Our code is open-source and available at https://gitlab.com/vgg/wise/wise.
Unveiling Reasoning Thresholds in Language Models: Scaling, Fine-Tuning, and Interpretability through Attention Maps
Feb 21, 2025This study investigates the in-context learning capabilities of various decoder-only transformer-based language models with different model sizes and training data, including GPT2, SmolLM2, OpenELM, TinyLlama, Stable LM, and Gemma 2. We identify a critical parameter threshold (~1.6 billion), beyond which reasoning performance improves significantly in tasks such as commonsense reasoning in multiple-choice question answering and deductive reasoning. Specifically, models above this threshold achieve better success rates in chain-of-thought (CoT) prompting for deductive reasoning tasks, especially those requiring longer reasoning chains, such as proof by contradiction and disjunction elimination. To address limitations in sub-threshold models, we demonstrate that fine-tuning with task-specific exemplars substantially enhances reasoning performance, enabling accurate CoT generation even without additional exemplars in the prompt for tasks with shorter reasoning chains. Finally, our analysis of attention maps reveals that models capable of generating correct CoTs exhibit higher token-level attention scores on subsequent correct tokens and the correct parts of speech, providing interpretability insights into reasoning processes. These findings collectively advance understanding of reasoning capabilities in decoder-only transformer-based models. The code is available at: https://github.com/AnnonymousForPapers/CoT_Reasoning_Test.
Adaptive Reasoning and Acting in Medical Language Agents
Oct 13, 2024This paper presents an innovative large language model (LLM) agent framework for enhancing diagnostic accuracy in simulated clinical environments using the AgentClinic benchmark. The proposed automatic correction enables doctor agents to iteratively refine their reasoning and actions following incorrect diagnoses, fostering improved decision-making over time. Experiments show that the implementation of the adaptive LLM-based doctor agents achieve correct diagnoses through dynamic interactions with simulated patients. The evaluations highlight the capacity of autonomous agents to adapt and improve in complex medical scenarios. Future enhancements will focus on refining the algorithm and expanding its applicability across a wider range of tasks and different large language models.
Efficient transformer with reinforced position embedding for language models
Oct 07, 2024In this paper, we propose an efficient transformer architecture that uses reinforced positional embedding to obtain superior performance with half the number of encoder decoder layers. We demonstrate that concatenating positional encoding with trainable token embeddings, normalizing columns in the token embedding matrix, and using the normalized token embedding matrix as the value of the attention layer improve the training and validation loss and the training time in an encoder-decoder Transformer model for a Portuguese-English translation task with 10 epochs or 12 hours of training across 10 trials. Our method, with roughly a threefold parameter reduction compared to the baseline model, yields a mean training loss of 1.21, a mean validation loss of 1.51, and an average training time of 1352.27 seconds per epoch, surpassing the baseline model with the same embedding dimension that employs addition of positional encoding and token embeddings, which achieves a mean training loss of 1.96, a validation loss of 2.18, and an average training time of 4297.79 seconds per epoch. Additionally, we evaluated our proposed architecture and the baseline across 14 diverse translation datasets from TensorFlow. The results indicate that our method consistently achieves lower or comparable training and validation losses, suggesting enhanced learning efficiency.
Towards Autonomous Agents: Adaptive-planning, Reasoning, and Acting in Language Models
Aug 12, 2024We propose a novel in-context learning algorithm for building autonomous decision-making language agents. The language agent continuously attempts to solve the same task by self-correcting each time the task fails. Our selected language agent demonstrates the ability to solve tasks in a text-based game environment. Our results show that the gemma-2-9b-it language model, using our proposed method, can successfully complete two of six tasks that failed in the first attempt. This highlights the effectiveness of our approach in enhancing the problem-solving capabilities of a single language model through self-correction, paving the way for more advanced autonomous agents. The code is publicly available at https://github.com/YenCheHsiao/AutonomousLLMAgentwithAdaptingPlanning.
Hybrid Coordinate Descent for Efficient Neural Network Learning Using Line Search and Gradient Descent
Aug 02, 2024This paper presents a novel coordinate descent algorithm leveraging a combination of one-directional line search and gradient information for parameter updates for a squared error loss function. Each parameter undergoes updates determined by either the line search or gradient method, contingent upon whether the modulus of the gradient of the loss with respect to that parameter surpasses a predefined threshold. Notably, a larger threshold value enhances algorithmic efficiency. Despite the potentially slower nature of the line search method relative to gradient descent, its parallelizability facilitates computational time reduction. Experimental validation conducted on a 2-layer Rectified Linear Unit network with synthetic data elucidates the impact of hyperparameters on convergence rates and computational efficiency.
Derivation of Back-propagation for Graph Convolutional Networks using Matrix Calculus and its Application to Explainable Artificial Intelligence
Aug 02, 2024


This paper provides a comprehensive and detailed derivation of the backpropagation algorithm for graph convolutional neural networks using matrix calculus. The derivation is extended to include arbitrary element-wise activation functions and an arbitrary number of layers. The study addresses two fundamental problems, namely node classification and link prediction. To validate our method, we compare it with reverse-mode automatic differentiation. The experimental results demonstrate that the median sum of squared errors of the updated weight matrices, when comparing our method to the approach using reverse-mode automatic differentiation, falls within the range of $10^{-18}$ to $10^{-14}$. These outcomes are obtained from conducting experiments on a five-layer graph convolutional network, applied to a node classification problem on Zachary's karate club social network and a link prediction problem on a drug-drug interaction network. Finally, we show how the derived closed-form solution can facilitate the development of explainable AI and sensitivity analysis.
A Comparative Study of Hierarchical Risk Parity Portfolio and Eigen Portfolio on the NIFTY 50 Stocks
Oct 03, 2022Portfolio optimization has been an area of research that has attracted a lot of attention from researchers and financial analysts. Designing an optimum portfolio is a complex task since it not only involves accurate forecasting of future stock returns and risks but also needs to optimize them. This paper presents a systematic approach to portfolio optimization using two approaches, the hierarchical risk parity algorithm and the Eigen portfolio on seven sectors of the Indian stock market. The portfolios are built following the two approaches to historical stock prices from Jan 1, 2016, to Dec 31, 2020. The portfolio performances are evaluated on the test data from Jan 1, 2021, to Nov 1, 2021. The backtesting results of the portfolios indicate that the performance of the HRP portfolio is superior to that of its Eigen counterpart on both training and test data for the majority of the sectors studied.
Precise Stock Price Prediction for Optimized Portfolio Design Using an LSTM Model
Mar 02, 2022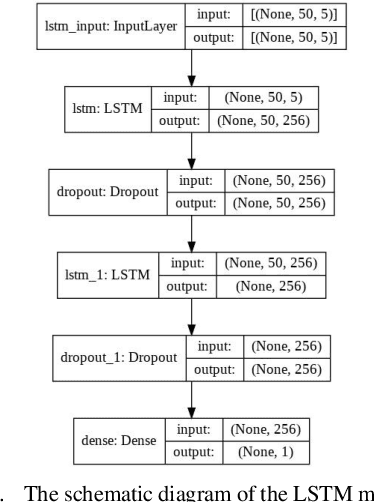
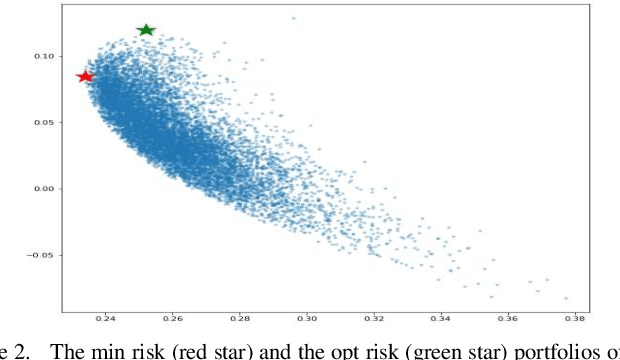
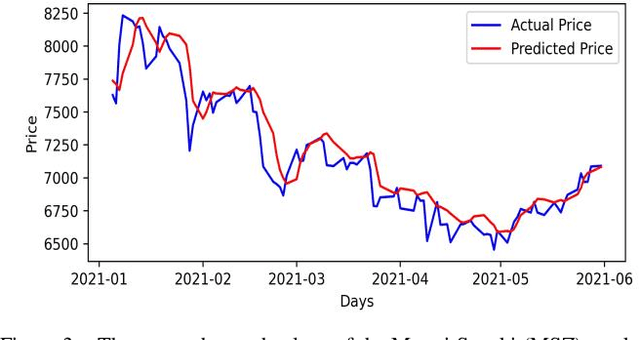
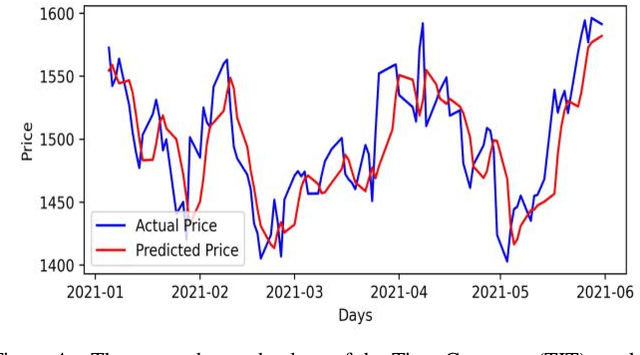
Accurate prediction of future prices of stocks is a difficult task to perform. Even more challenging is to design an optimized portfolio of stocks with the identification of proper weights of allocation to achieve the optimized values of return and risk. We present optimized portfolios based on the seven sectors of the Indian economy. The past prices of the stocks are extracted from the web from January 1, 2016, to December 31, 2020. Optimum portfolios are designed on the selected seven sectors. An LSTM regression model is also designed for predicting future stock prices. Five months after the construction of the portfolios, i.e., on June 1, 2021, the actual and predicted returns and risks of each portfolio are computed. The predicted and the actual returns indicate the very high accuracy of the LSTM model.
Hierarchical Risk Parity and Minimum Variance Portfolio Design on NIFTY 50 Stocks
Feb 06, 2022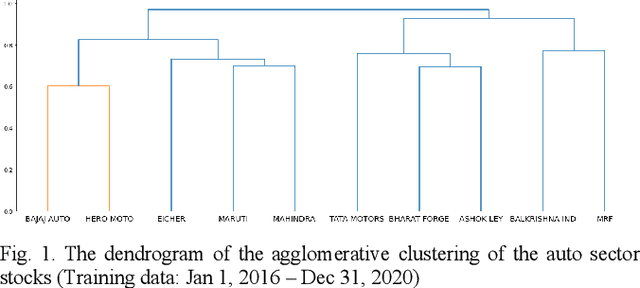
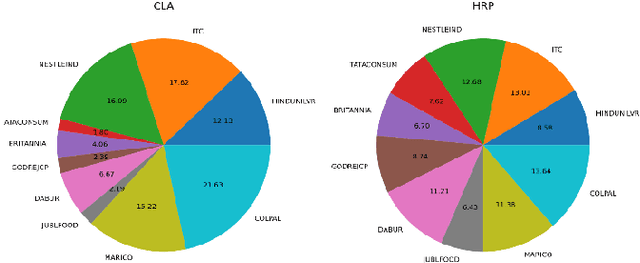
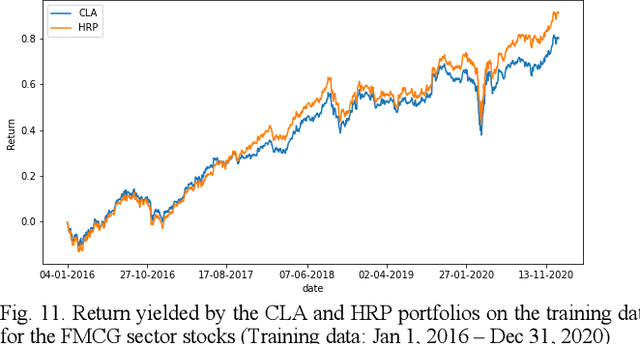
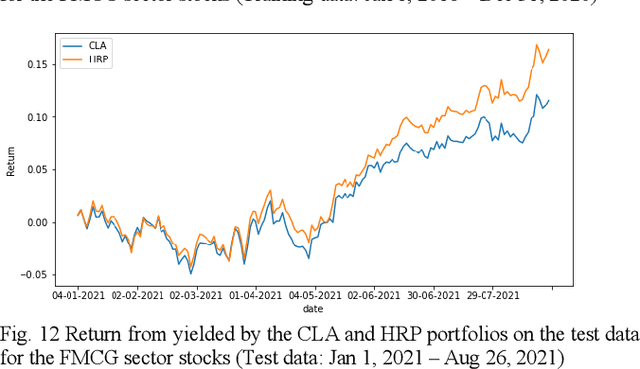
Portfolio design and optimization have been always an area of research that has attracted a lot of attention from researchers from the finance domain. Designing an optimum portfolio is a complex task since it involves accurate forecasting of future stock returns and risks and making a suitable tradeoff between them. This paper proposes a systematic approach to designing portfolios using two algorithms, the critical line algorithm, and the hierarchical risk parity algorithm on eight sectors of the Indian stock market. While the portfolios are designed using the stock price data from Jan 1, 2016, to Dec 31, 2020, they are tested on the data from Jan 1, 2021, to Aug 26, 2021. The backtesting results of the portfolios indicate while the performance of the CLA algorithm is superior on the training data, the HRP algorithm has outperformed the CLA algorithm on the test data.