 Add to Chrome
 Add to Firefox
 Add to Edge
"Time": models, code, and papers
Unsupervised high-throughput segmentation of cells and cell nuclei in quantitative phase images
Nov 24, 2023
In the effort to aid cytologic diagnostics by establishing automatic single cell screening using high throughput digital holographic microscopy for clinical studies thousands of images and millions of cells are captured. The bottleneck lies in an automatic, fast, and unsupervised segmentation technique that does not limit the types of cells which might occur. We propose an unsupervised multistage method that segments correctly without confusing noise or reflections with cells and without missing cells that also includes the detection of relevant inner structures, especially the cell nucleus in the unstained cell. In an effort to make the information reasonable and interpretable for cytopathologists, we also introduce new cytoplasmic and nuclear features of potential help for cytologic diagnoses which exploit the quantitative phase information inherent to the measurement scheme. We show that the segmentation provides consistently good results over many experiments on patient samples in a reasonable per cell analysis time.
Set Features for Anomaly Detection
Nov 24, 2023This paper proposes set features for detecting anomalies in samples that consist of unusual combinations of normal elements. Many leading methods discover anomalies by detecting an unusual part of a sample. For example, state-of-the-art segmentation-based approaches, first classify each element of the sample (e.g., image patch) as normal or anomalous and then classify the entire sample as anomalous if it contains anomalous elements. However, such approaches do not extend well to scenarios where the anomalies are expressed by an unusual combination of normal elements. In this paper, we overcome this limitation by proposing set features that model each sample by the distribution of its elements. We compute the anomaly score of each sample using a simple density estimation method, using fixed features. Our approach outperforms the previous state-of-the-art in image-level logical anomaly detection and sequence-level time series anomaly detection.
You Only Explain Once
Nov 23, 2023In this paper, we propose a new black-box explainability algorithm and tool, YO-ReX, for efficient explanation of the outputs of object detectors. The new algorithm computes explanations for all objects detected in the image simultaneously. Hence, compared to the baseline, the new algorithm reduces the number of queries by a factor of 10X for the case of ten detected objects. The speedup increases further with with the number of objects. Our experimental results demonstrate that YO-ReX can explain the outputs of YOLO with a negligible overhead over the running time of YOLO. We also demonstrate similar results for explaining SSD and Faster R-CNN. The speedup is achieved by avoiding backtracking by combining aggressive pruning with a causal analysis.
Multi-Agent Learning of Efficient Fulfilment and Routing Strategies in E-Commerce
Nov 20, 2023This paper presents an integrated algorithmic framework for minimising product delivery costs in e-commerce (known as the cost-to-serve or C2S). One of the major challenges in e-commerce is the large volume of spatio-temporally diverse orders from multiple customers, each of which has to be fulfilled from one of several warehouses using a fleet of vehicles. This results in two levels of decision-making: (i) selection of a fulfillment node for each order (including the option of deferral to a future time), and then (ii) routing of vehicles (each of which can carry multiple orders originating from the same warehouse). We propose an approach that combines graph neural networks and reinforcement learning to train the node selection and vehicle routing agents. We include real-world constraints such as warehouse inventory capacity, vehicle characteristics such as travel times, service times, carrying capacity, and customer constraints including time windows for delivery. The complexity of this problem arises from the fact that outcomes (rewards) are driven both by the fulfillment node mapping as well as the routing algorithms, and are spatio-temporally distributed. Our experiments show that this algorithmic pipeline outperforms pure heuristic policies.
A Machine Learning-based Algorithm for Automated Detection of Frequency-based Events in Recorded Time Series of Sensor Data
Oct 16, 2023Automated event detection has emerged as one of the fundamental practices to monitor the behavior of technical systems by means of sensor data. In the automotive industry, these methods are in high demand for tracing events in time series data. For assessing the active vehicle safety systems, a diverse range of driving scenarios is conducted. These scenarios involve the recording of the vehicle's behavior using external sensors, enabling the evaluation of operational performance. In such setting, automated detection methods not only accelerate but also standardize and objectify the evaluation by avoiding subjective, human-based appraisals in the data inspection. This work proposes a novel event detection method that allows to identify frequency-based events in time series data. To this aim, the time series data is mapped to representations in the time-frequency domain, known as scalograms. After filtering scalograms to enhance relevant parts of the signal, an object detection model is trained to detect the desired event objects in the scalograms. For the analysis of unseen time series data, events can be detected in their scalograms with the trained object detection model and are thereafter mapped back to the time series data to mark the corresponding time interval. The algorithm, evaluated on unseen datasets, achieves a precision rate of 0.97 in event detection, providing sharp time interval boundaries whose accurate indication by human visual inspection is challenging. Incorporating this method into the vehicle development process enhances the accuracy and reliability of event detection, which holds major importance for rapid testing analysis.
What User Behaviors Make the Differences During the Process of Visual Analytics?
Nov 17, 2023The understanding of visual analytics process can benefit visualization researchers from multiple aspects, including improving visual designs and developing advanced interaction functions. However, the log files of user behaviors are still hard to analyze due to the complexity of sensemaking and our lack of knowledge on the related user behaviors. This work presents a study on a comprehensive data collection of user behaviors, and our analysis approach with time-series classification methods. We have chosen a classical visualization application, Covid-19 data analysis, with common analysis tasks covering geo-spatial, time-series and multi-attributes. Our user study collects user behaviors on a diverse set of visualization tasks with two comparable systems, desktop and immersive visualizations. We summarize the classification results with three time-series machine learning algorithms at two scales, and explore the influences of behavior features. Our results reveal that user behaviors can be distinguished during the process of visual analytics and there is a potentially strong association between the physical behaviors of users and the visualization tasks they perform. We also demonstrate the usage of our models by interpreting open sessions of visual analytics, which provides an automatic way to study sensemaking without tedious manual annotations.
Generalized Mixture Model for Extreme Events Forecasting in Time Series Data
Oct 11, 2023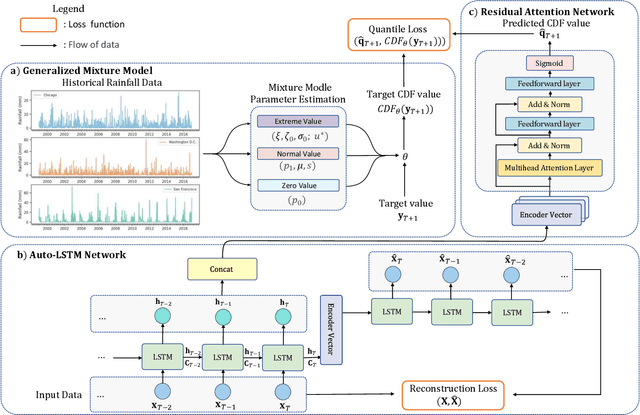
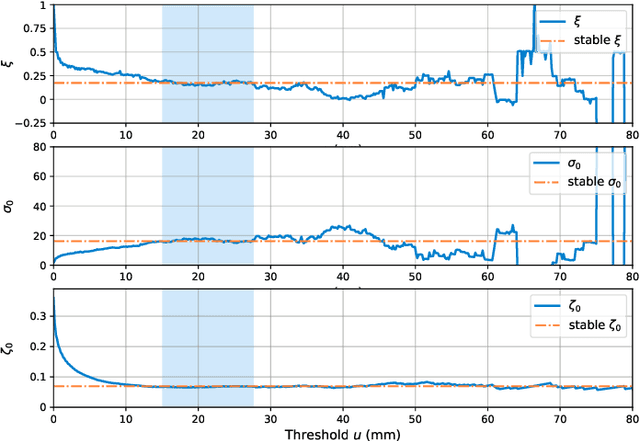
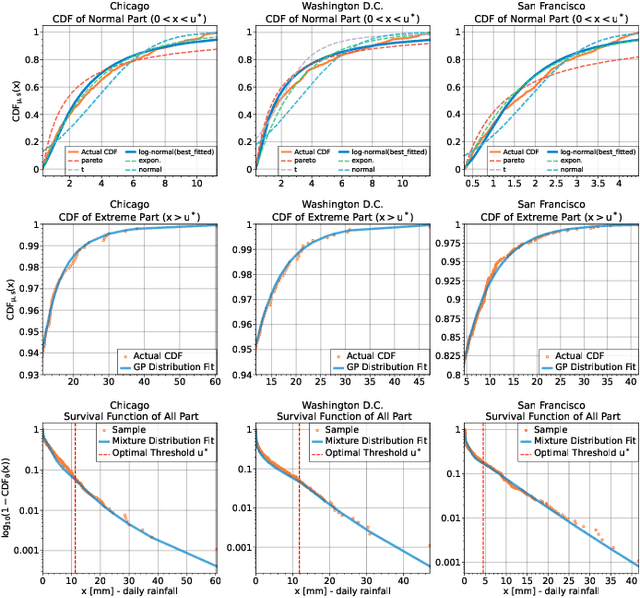
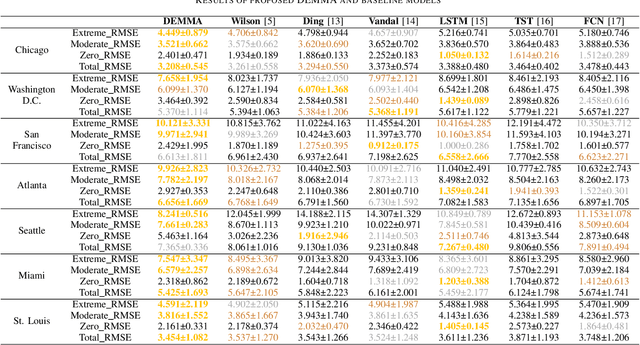
Time Series Forecasting (TSF) is a widely researched topic with broad applications in weather forecasting, traffic control, and stock price prediction. Extreme values in time series often significantly impact human and natural systems, but predicting them is challenging due to their rare occurrence. Statistical methods based on Extreme Value Theory (EVT) provide a systematic approach to modeling the distribution of extremes, particularly the Generalized Pareto (GP) distribution for modeling the distribution of exceedances beyond a threshold. To overcome the subpar performance of deep learning in dealing with heavy-tailed data, we propose a novel framework to enhance the focus on extreme events. Specifically, we propose a Deep Extreme Mixture Model with Autoencoder (DEMMA) for time series prediction. The model comprises two main modules: 1) a generalized mixture distribution based on the Hurdle model and a reparameterized GP distribution form independent of the extreme threshold, 2) an Autoencoder-based LSTM feature extractor and a quantile prediction module with a temporal attention mechanism. We demonstrate the effectiveness of our approach on multiple real-world rainfall datasets.
Automated Measurement of Vascular Calcification in Femoral Endarterectomy Patients Using Deep Learning
Nov 27, 2023Atherosclerosis, a chronic inflammatory disease affecting the large arteries, presents a global health risk. Accurate analysis of diagnostic images, like computed tomographic angiograms (CTAs), is essential for staging and monitoring the progression of atherosclerosis-related conditions, including peripheral arterial disease (PAD). However, manual analysis of CTA images is time-consuming and tedious. To address this limitation, we employed a deep learning model to segment the vascular system in CTA images of PAD patients undergoing femoral endarterectomy surgery and to measure vascular calcification from the left renal artery to the patella. Utilizing proprietary CTA images of 27 patients undergoing femoral endarterectomy surgery provided by Prisma Health Midlands, we developed a Deep Neural Network (DNN) model to first segment the arterial system, starting from the descending aorta to the patella, and second, to provide a metric of arterial calcification. Our designed DNN achieved 83.4% average Dice accuracy in segmenting arteries from aorta to patella, advancing the state-of-the-art by 0.8%. Furthermore, our work is the first to present a robust statistical analysis of automated calcification measurement in the lower extremities using deep learning, attaining a Mean Absolute Percentage Error (MAPE) of 9.5% and a correlation coefficient of 0.978 between automated and manual calcification scores. These findings underscore the potential of deep learning techniques as a rapid and accurate tool for medical professionals to assess calcification in the abdominal aorta and its branches above the patella. The developed DNN model and related documentation in this project are available at GitHub page at https://github.com/pip-alireza/DeepCalcScoring.
* Published in MDPI Diagnostic journal, the code can be accessed via the GitHub link in the paper
The Graph Convolutional Network with Multi-representation Alignment for Drug Synergy Prediction
Nov 27, 2023Drug combination refers to the use of two or more drugs to treat a specific disease at the same time. It is currently the mainstream way to treat complex diseases. Compared with single drugs, drug combinations have better efficacy and can better inhibit toxicity and drug resistance. The computational model based on deep learning concatenates the representation of multiple drugs and the corresponding cell line feature as input, and the output is whether the drug combination can have an inhibitory effect on the cell line. However, this strategy of concatenating multiple representations has the following defects: the alignment of drug representation and cell line representation is ignored, resulting in the synergistic relationship not being reflected positionally in the embedding space. Moreover, the alignment measurement function in deep learning cannot be suitable for drug synergy prediction tasks due to differences in input types. Therefore, in this work, we propose a graph convolutional network with multi-representation alignment (GCNMRA) for predicting drug synergy. In the GCNMRA model, we designed a multi-representation alignment function suitable for the drug synergy prediction task so that the positional relationship between drug representations and cell line representation is reflected in the embedding space. In addition, the vector modulus of drug representations and cell line representation is considered to improve the accuracy of calculation results and accelerate model convergence. Finally, many relevant experiments were run on multiple drug synergy datasets to verify the effectiveness of the above innovative elements and the excellence of the GCNMRA model.
Small and Dim Target Detection in IR Imagery: A Review
Nov 27, 2023While there has been significant progress in object detection using conventional image processing and machine learning algorithms, exploring small and dim target detection in the IR domain is a relatively new area of study. The majority of small and dim target detection methods are derived from conventional object detection algorithms, albeit with some alterations. The task of detecting small and dim targets in IR imagery is complex. This is because these targets often need distinct features, the background is cluttered with unclear details, and the IR signatures of the scene can change over time due to fluctuations in thermodynamics. The primary objective of this review is to highlight the progress made in this field. This is the first review in the field of small and dim target detection in infrared imagery, encompassing various methodologies ranging from conventional image processing to cutting-edge deep learning-based approaches. The authors have also introduced a taxonomy of such approaches. There are two main types of approaches: methodologies using several frames for detection, and single-frame-based detection techniques. Single frame-based detection techniques encompass a diverse range of methods, spanning from traditional image processing-based approaches to more advanced deep learning methodologies. Our findings indicate that deep learning approaches perform better than traditional image processing-based approaches. In addition, a comprehensive compilation of various available datasets has also been provided. Furthermore, this review identifies the gaps and limitations in existing techniques, paving the way for future research and development in this area.