 Add to Chrome
 Add to Firefox
 Add to Edge
"Time": models, code, and papers
PoseKernelLifter: Metric Lifting of 3D Human Pose using Sound
Dec 01, 2021
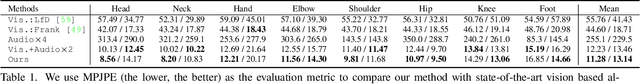
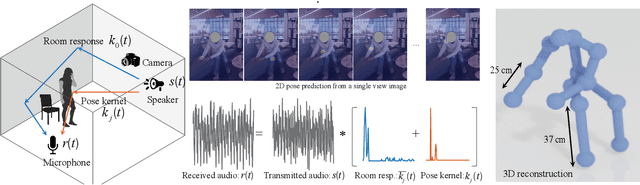
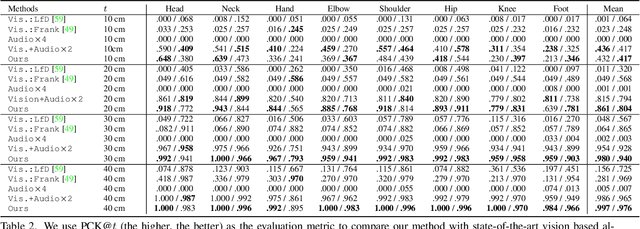
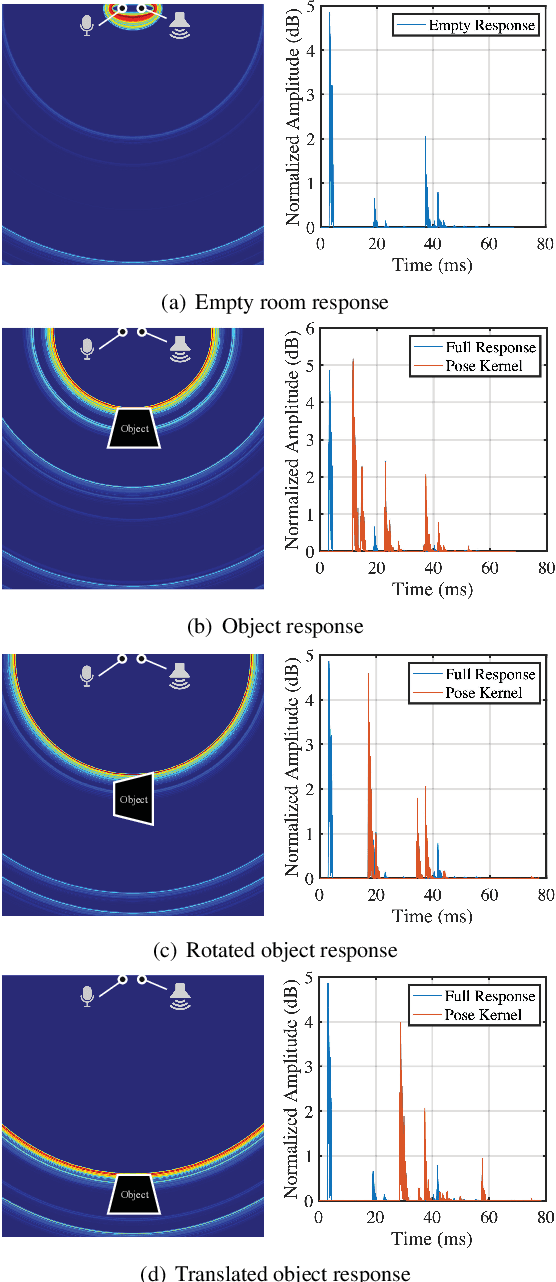
Reconstructing the 3D pose of a person in metric scale from a single view image is a geometrically ill-posed problem. For example, we can not measure the exact distance of a person to the camera from a single view image without additional scene assumptions (e.g., known height). Existing learning based approaches circumvent this issue by reconstructing the 3D pose up to scale. However, there are many applications such as virtual telepresence, robotics, and augmented reality that require metric scale reconstruction. In this paper, we show that audio signals recorded along with an image, provide complementary information to reconstruct the metric 3D pose of the person. The key insight is that as the audio signals traverse across the 3D space, their interactions with the body provide metric information about the body's pose. Based on this insight, we introduce a time-invariant transfer function called pose kernel -- the impulse response of audio signals induced by the body pose. The main properties of the pose kernel are that (1) its envelope highly correlates with 3D pose, (2) the time response corresponds to arrival time, indicating the metric distance to the microphone, and (3) it is invariant to changes in the scene geometry configurations. Therefore, it is readily generalizable to unseen scenes. We design a multi-stage 3D CNN that fuses audio and visual signals and learns to reconstruct 3D pose in a metric scale. We show that our multi-modal method produces accurate metric reconstruction in real world scenes, which is not possible with state-of-the-art lifting approaches including parametric mesh regression and depth regression.
A Sensitivity Analysis of the MSMARCO Passage Collection
Jan 11, 2022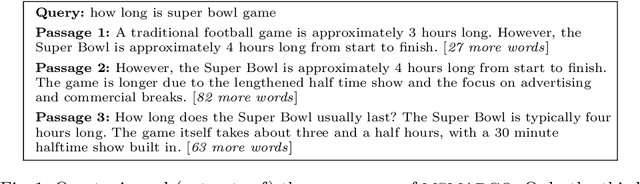
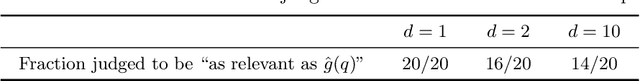
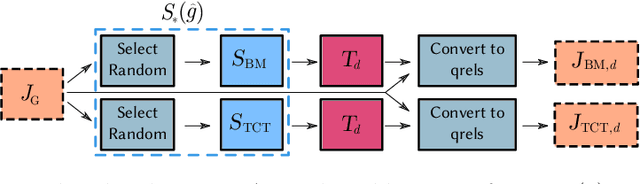
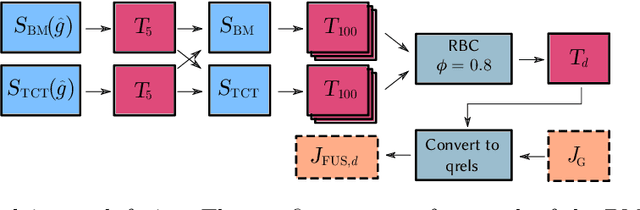
The recent MSMARCO passage retrieval collection has allowed researchers to develop highly tuned retrieval systems. One aspect of this data set that makes it distinctive compared to traditional corpora is that most of the topics only have a single answer passage marked relevant. Here we carry out a "what if" sensitivity study, asking whether a set of systems would still have the same relative performance if more passages per topic were deemed to be "relevant", exploring several mechanisms for identifying sets of passages to be so categorized. Our results show that, in general, while run scores can vary markedly if additional plausible passages are presumed to be relevant, the derived system ordering is relatively insensitive to additional relevance, providing support for the methodology that was used at the time the MSMARCO passage collection was created.
A Lightweight, Efficient and Explainable-by-Design Convolutional Neural Network for Internet Traffic Classification
Feb 11, 2022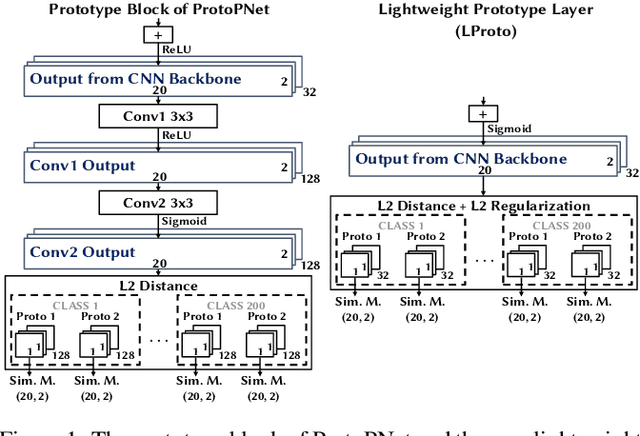
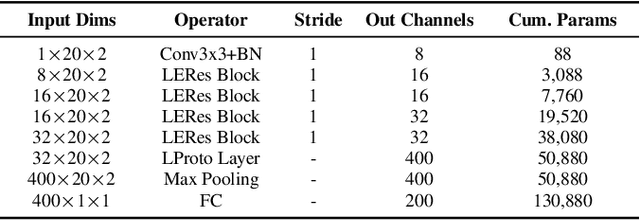
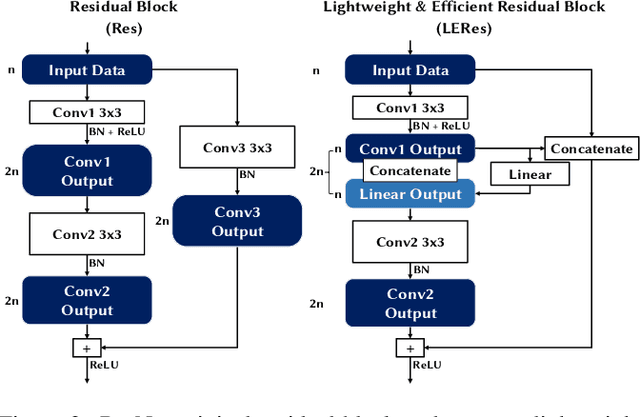
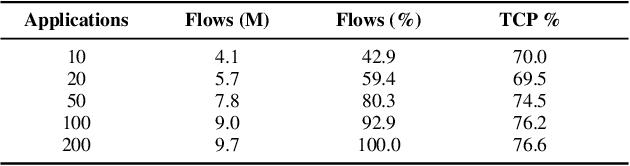
Traffic classification, i.e. the identification of the type of applications flowing in a network, is a strategic task for numerous activities (e.g., intrusion detection, routing). This task faces some critical challenges that current deep learning approaches do not address. The design of current approaches do not take into consideration the fact that networking hardware (e.g., routers) often runs with limited computational resources. Further, they do not meet the need for faithful explainability highlighted by regulatory bodies. Finally, these traffic classifiers are evaluated on small datasets which fail to reflect the diversity of applications in real commercial settings. Therefore, this paper introduces a Lightweight, Efficient and eXplainable-by-design convolutional neural network (LEXNet) for Internet traffic classification, which relies on a new residual block (for lightweight and efficiency purposes) and prototype layer (for explainability). Based on a commercial-grade dataset, our evaluation shows that LEXNet succeeds to maintain the same accuracy as the best performing state-of-the-art neural network, while providing the additional features previously mentioned. Moreover, we demonstrate that LEXNet significantly reduces the model size and inference time compared to the state-of-the-art neural networks with explainability-by-design and post hoc explainability methods. Finally, we illustrate the explainability feature of our approach, which stems from the communication of detected application prototypes to the end-user, and we highlight the faithfulness of LEXNet explanations through a comparison with post hoc methods.
Pipe Climbing Robot
Jan 19, 2022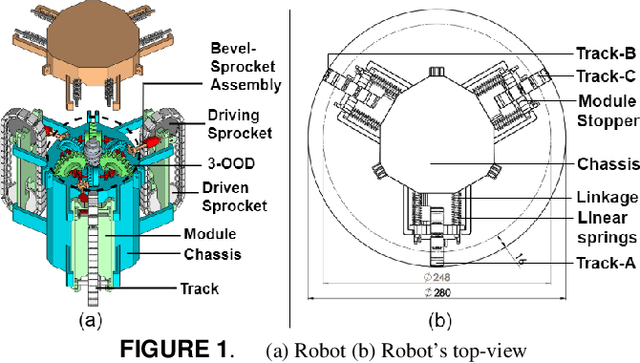
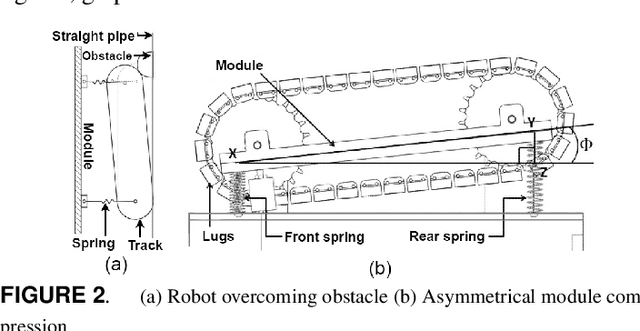
This paper presents the plan of an in-pipe climbing robot that works utilizing a novel Three-Output Open Differential(3-OOD) component to navigate complex organizations of lines. Customary wheeled/followed in-pipe climbing robots are inclined to slip and haul while navigating in pipe twists. The 3-OOD component helps in accomplishing the original aftereffect of wiping out slip and drag in the robot tracks during movement. The proposed differential understands the practical capacities of the customary two-yield differential, which is accomplished the initial time for a differential with three results. The 3-OOD component precisely tweaks the track rates of the robot in light of the powers applied on each track inside the line organization, by wiping out the requirement for any dynamic control. The recreation of the robot crossing in the line network in various directions and in pipe-twists without slip shows the proposed plan's adequacy
Online Fair Revenue Maximizing Cake Division with Non-Contiguous Pieces in Adversarial Bandits
Nov 29, 2021The classic cake-cutting problem provides a model for addressing the fair and efficient allocation of a divisible, heterogeneous resource among agents with distinct preferences. Focusing on a standard formulation of cake cutting, in which each agent must receive a contiguous piece of the cake in an offline setting, this work instead focuses on online allocating non-contiguous pieces of cake among agents and establishes algorithmic results for fairness measures. In this regard, we made use of classic adversarial multi-armed bandits to achieve sub-linear Fairness and Revenue Regret at the same time. Adversarial bandits are powerful tools to model the adversarial reinforcement learning environments, that provide strong upper-bounds for regret of learning with just observing one action's reward in each step by applying smart trade-off between exploration and exploitation. This work studies the power of the famous EXP_3 algorithm that is based on exponential wight{-}importance updating probability distribution through time horizon.
Using Sequential Statistical Tests to Improve the Performance of Random Search in hyperparameter Tuning
Dec 23, 2021
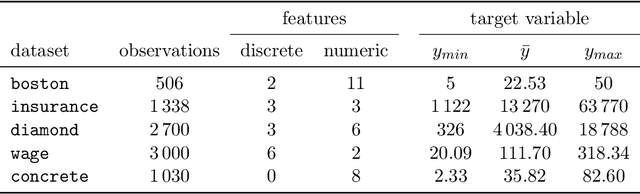
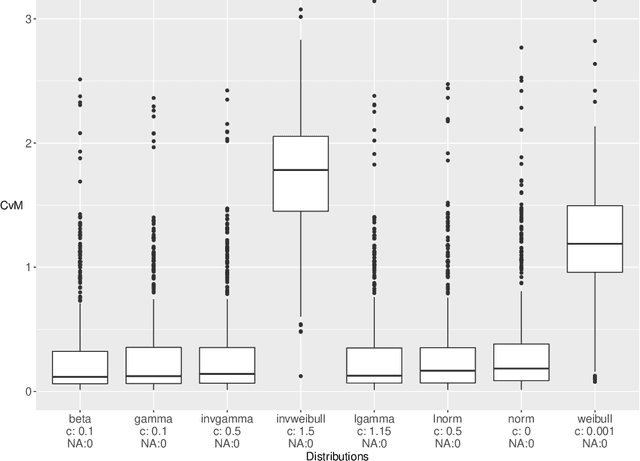
Hyperparamter tuning is one of the the most time-consuming parts in machine learning: The performance of a large number of different hyperparameter settings has to be evaluated to find the best one. Although modern optimization algorithms exist that minimize the number of evaluations needed, the evaluation of a single setting is still expensive: Using a resampling technique, the machine learning method has to be fitted a fixed number of $K$ times on different training data sets. As an estimator for the performance of the setting the respective mean value of the $K$ fits is used. Many hyperparameter settings could be discarded after less than $K$ resampling iterations, because they already are clearly inferior to high performing settings. However, in practice, the resampling is often performed until the very end, wasting a lot of computational effort. We propose to use a sequential testing procedure to minimize the number of resampling iterations to detect inferior parameter setting. To do so, we first analyze the distribution of resampling errors, we will find out, that a log-normal distribution is promising. Afterwards, we build a sequential testing procedure assuming this distribution. This sequential test procedure is utilized within a random search algorithm. We compare a standard random search with our enhanced sequential random search in some realistic data situation. It can be shown that the sequential random search is able to find comparably good hyperparameter settings, however, the computational time needed to find those settings is roughly halved.
Introducing explainable supervised machine learning into interactive feedback loops for statistical production system
Feb 07, 2022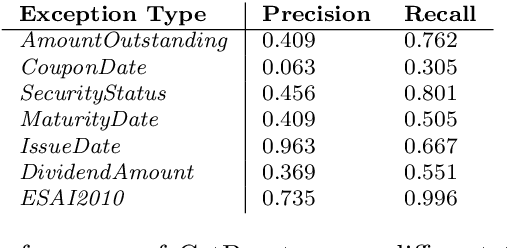
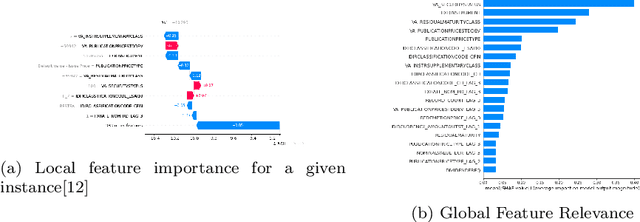
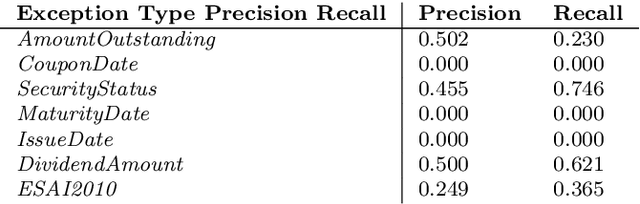
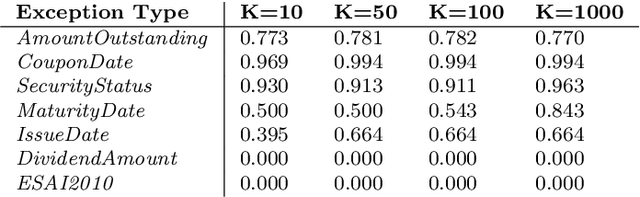
Statistical production systems cover multiple steps from the collection, aggregation, and integration of data to tasks like data quality assurance and dissemination. While the context of data quality assurance is one of the most promising fields for applying machine learning, the lack of curated and labeled training data is often a limiting factor. The statistical production system for the Centralised Securities Database features an interactive feedback loop between data collected by the European Central Bank and data quality assurance performed by data quality managers at National Central Banks. The quality assurance feedback loop is based on a set of rule-based checks for raising exceptions, upon which the user either confirms the data or corrects an actual error. In this paper we use the information received from this feedback loop to optimize the exceptions presented to the National Central Banks thereby improving the quality of exceptions generated and the time consumed on the system by the users authenticating those exceptions. For this approach we make use of explainable supervised machine learning to (a) identify the types of exceptions and (b) to prioritize which exceptions are more likely to require an intervention or correction by the NCBs. Furthermore, we provide an explainable AI taxonomy aiming to identify the different explainable AI needs that arose during the project.
Towards the automated large-scale reconstruction of past road networks from historical maps
Feb 11, 2022
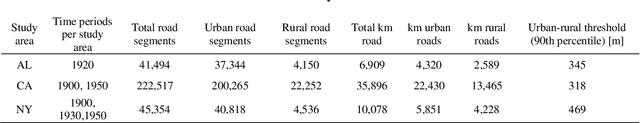
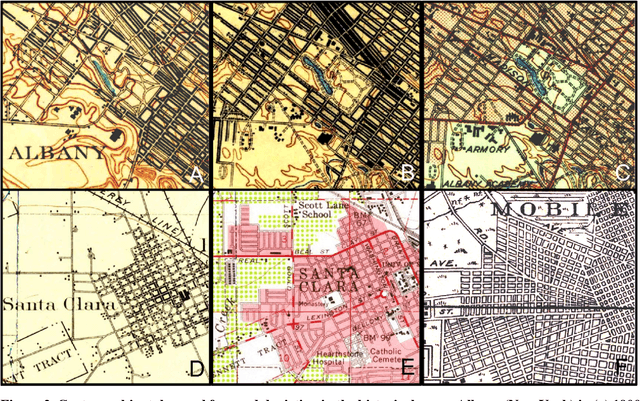
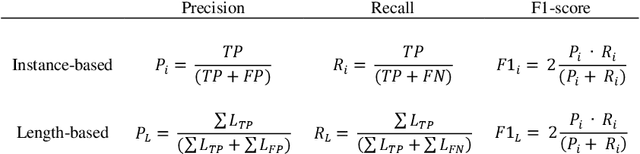
Transportation infrastructure, such as road or railroad networks, represent a fundamental component of our civilization. For sustainable planning and informed decision making, a thorough understanding of the long-term evolution of transportation infrastructure such as road networks is crucial. However, spatially explicit, multi-temporal road network data covering large spatial extents are scarce and rarely available prior to the 2000s. Herein, we propose a framework that employs increasingly available scanned and georeferenced historical map series to reconstruct past road networks, by integrating abundant, contemporary road network data and color information extracted from historical maps. Specifically, our method uses contemporary road segments as analytical units and extracts historical roads by inferring their existence in historical map series based on image processing and clustering techniques. We tested our method on over 300,000 road segments representing more than 50,000 km of the road network in the United States, extending across three study areas that cover 53 historical topographic map sheets dated between 1890 and 1950. We evaluated our approach by comparison to other historical datasets and against manually created reference data, achieving F-1 scores of up to 0.95, and showed that the extracted road network statistics are highly plausible over time, i.e., following general growth patterns. We demonstrated that contemporary geospatial data integrated with information extracted from historical map series open up new avenues for the quantitative analysis of long-term urbanization processes and landscape changes far beyond the era of operational remote sensing and digital cartography.
Investigating underdiagnosis of AI algorithms in the presence of multiple sources of dataset bias
Jan 19, 2022Deep learning models have shown great potential for image-based diagnosis assisting clinical decision making. At the same time, an increasing number of reports raise concerns about the potential risk that machine learning could amplify existing health disparities due to human biases that are embedded in the training data. It is of great importance to carefully investigate the extent to which biases may be reproduced or even amplified if we wish to build fair artificial intelligence systems. Seyyed-Kalantari et al. advance this conversation by analysing the performance of a disease classifier across population subgroups. They raise performance disparities related to underdiagnosis as a point of concern; we identify areas from this analysis which we believe deserve additional attention. Specifically, we wish to highlight some theoretical and practical difficulties associated with assessing model fairness through testing on data drawn from the same biased distribution as the training data, especially when the sources and amount of biases are unknown.
Recognition and Co-Analysis of Pedestrian Activities in Different Parts of Road using Traffic Camera Video
Nov 27, 2021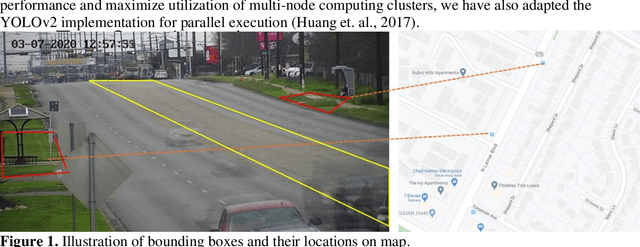
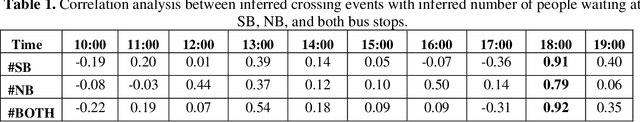
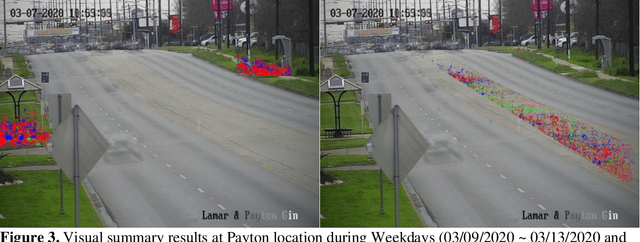
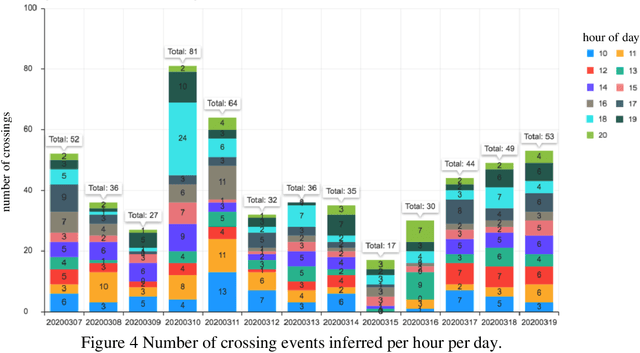
Pedestrian safety is a priority for transportation system managers and operators, and a main focus of the Vision Zero strategy employed by the City of Austin, Texas. While there are a number of treatments and technologies to effectively improve pedestrian safety, identifying the location where these treatments are most needed remains a challenge. Current practice requires manual observation of candidate locations for limited time periods, leading to an identification process that is time consuming, lags behind traffic pattern changes over time, and lacks scalability. Mid-block locations, where safety countermeasures are often needed the most, are especially hard to identify and monitor. The goal for this research is to understand the correlation between bus stop locations and mid-block crossings, so as to assist traffic engineers in implementing Vision Zero strategies to improve pedestrian safety. In a prior work, we have developed a tool to detect pedestrian crossing events with traffic camera video using a deep neural network model to identify crossing events. In this paper, we extend the methods to identify bus stop usage with traffic camera video from off-the-shelf CCTV pan-tilt-zoom (PTZ) traffic monitoring cameras installed at nearby intersections. We correlate the video detection results for mid-block crossings near a bus stop, with pedestrian activity at the bus stops in each side of the mid-block crossing. We also implement a web portal to facilitate manual review of pedestrian activity detections by automating creation of video clips that show only crossing events, thereby vastly improving the efficiency of the human review process.