 Add to Chrome
 Add to Firefox
 Add to Edge
"Time Series Analysis": models, code, and papers
Sliding Spectrum Decomposition for Diversified Recommendation
Jul 12, 2021

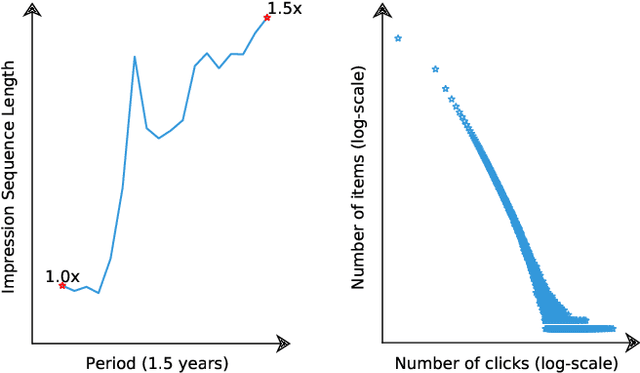
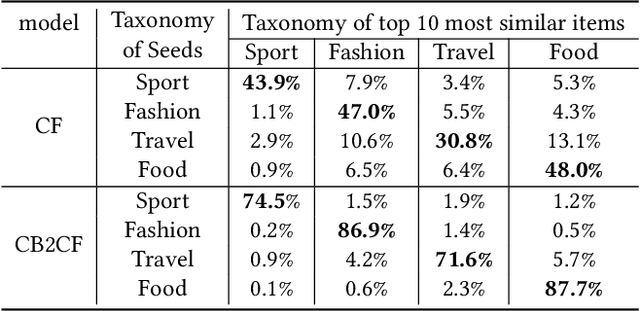

Content feed, a type of product that recommends a sequence of items for users to browse and engage with, has gained tremendous popularity among social media platforms. In this paper, we propose to study the diversity problem in such a scenario from an item sequence perspective using time series analysis techniques. We derive a method called sliding spectrum decomposition (SSD) that captures users' perception of diversity in browsing a long item sequence. We also share our experiences in designing and implementing a suitable item embedding method for accurate similarity measurement under long tail effect. Combined together, they are now fully implemented and deployed in Xiaohongshu App's production recommender system that serves the main Explore Feed product for tens of millions of users every day. We demonstrate the effectiveness and efficiency of the method through theoretical analysis, offline experiments and online A/B tests.
PIETS: Parallelised Irregularity Encoders for Forecasting with Heterogeneous Time-Series
Oct 06, 2021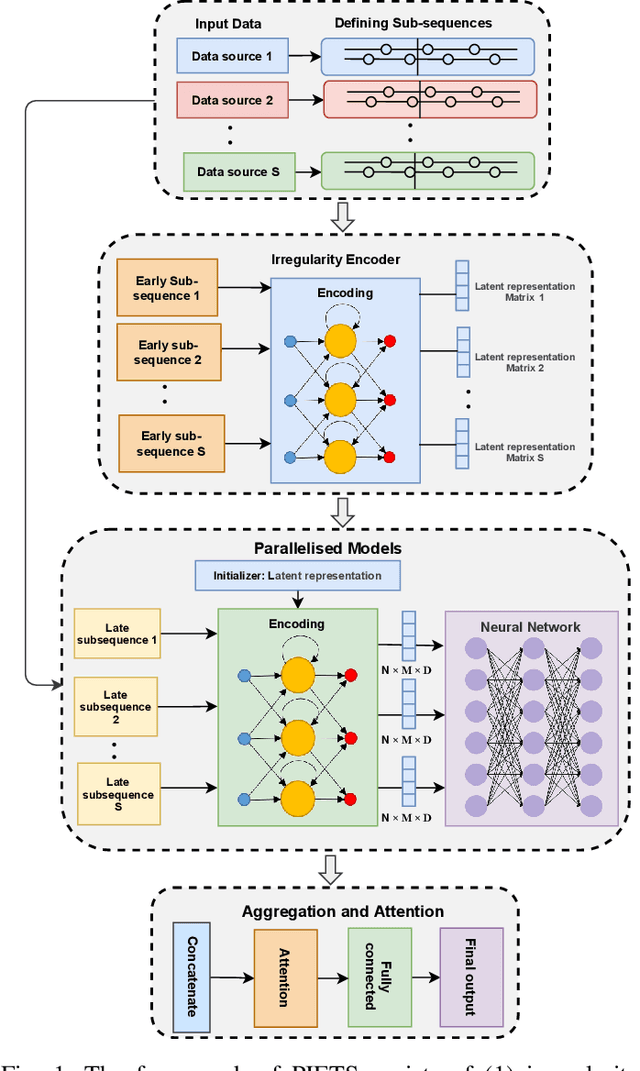
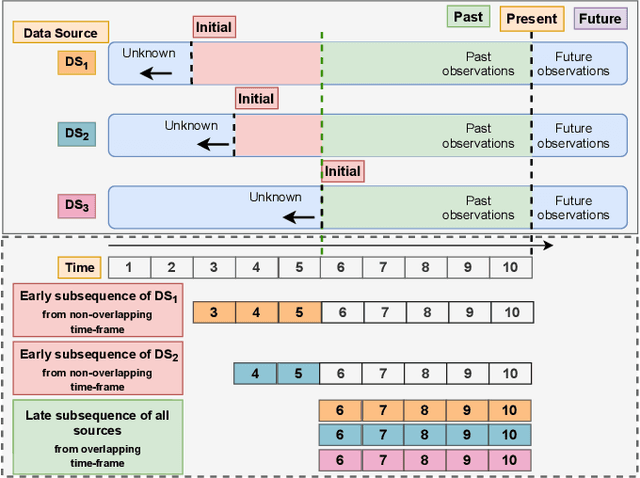
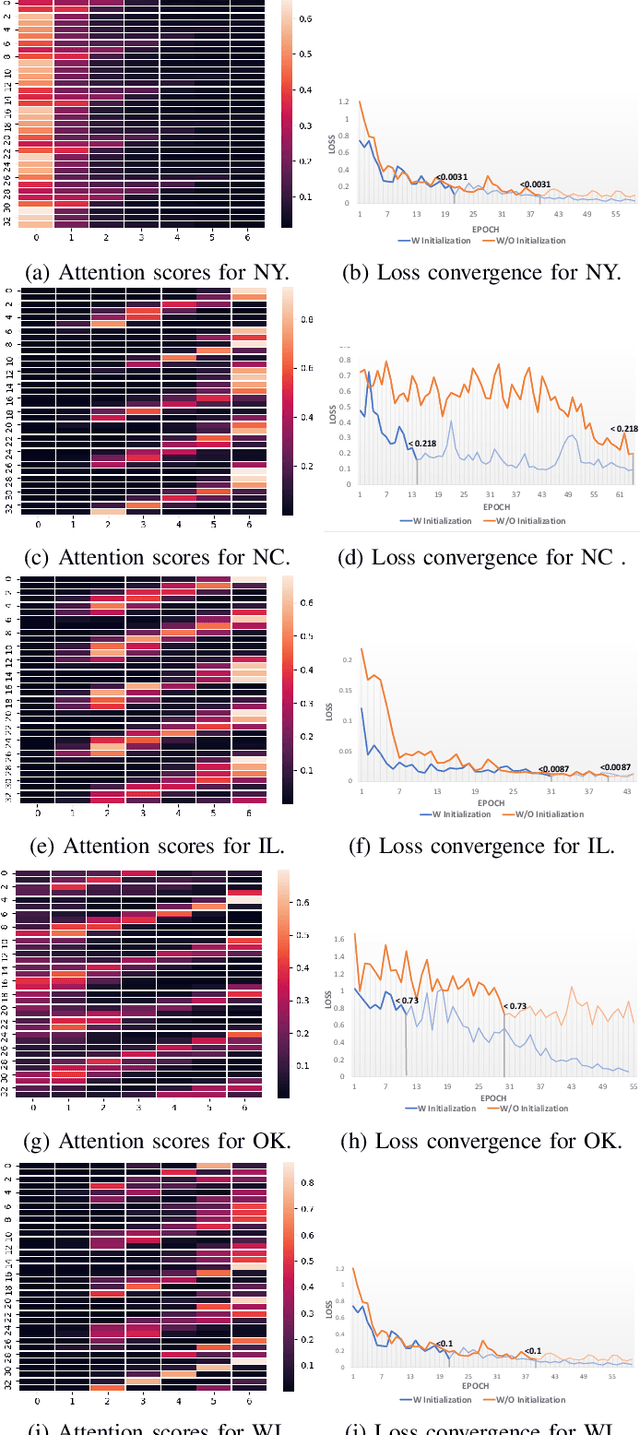
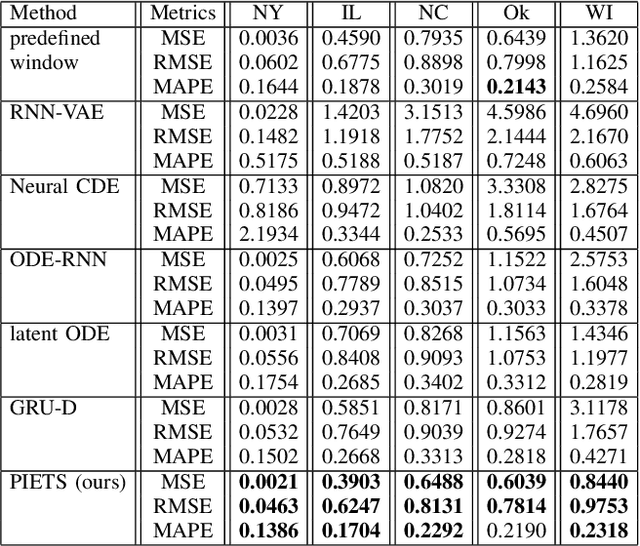
Heterogeneity and irregularity of multi-source data sets present a significant challenge to time-series analysis. In the literature, the fusion of multi-source time-series has been achieved either by using ensemble learning models which ignore temporal patterns and correlation within features or by defining a fixed-size window to select specific parts of the data sets. On the other hand, many studies have shown major improvement to handle the irregularity of time-series, yet none of these studies has been applied to multi-source data. In this work, we design a novel architecture, PIETS, to model heterogeneous time-series. PIETS has the following characteristics: (1) irregularity encoders for multi-source samples that can leverage all available information and accelerate the convergence of the model; (2) parallelised neural networks to enable flexibility and avoid information overwhelming; and (3) attention mechanism that highlights different information and gives high importance to the most related data. Through extensive experiments on real-world data sets related to COVID-19, we show that the proposed architecture is able to effectively model heterogeneous temporal data and outperforms other state-of-the-art approaches in the prediction task.
Interpreting County Level COVID-19 Infection and Feature Sensitivity using Deep Learning Time Series Models
Oct 06, 2022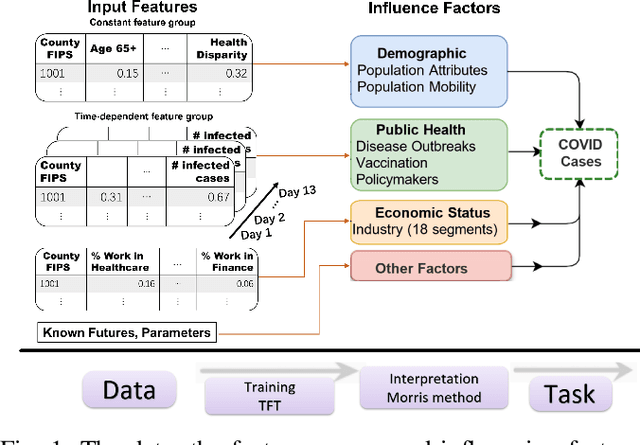
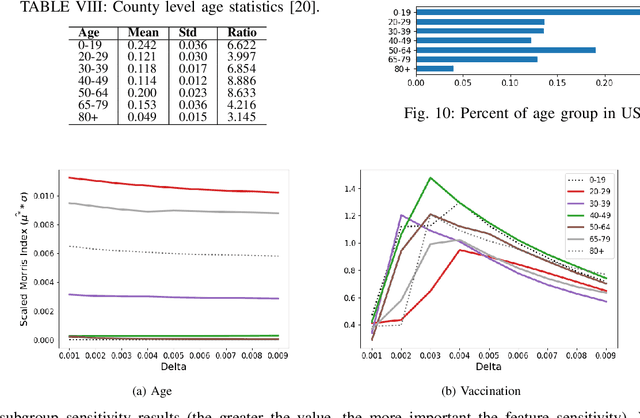
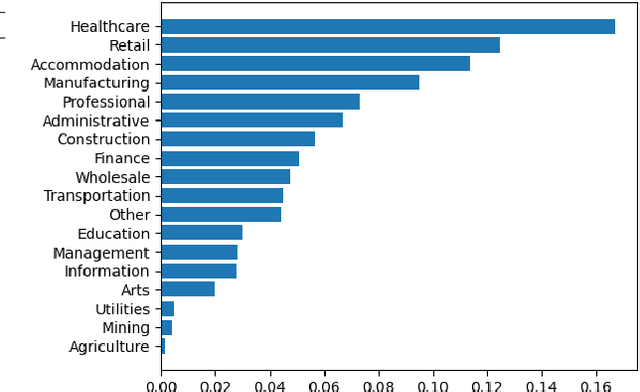
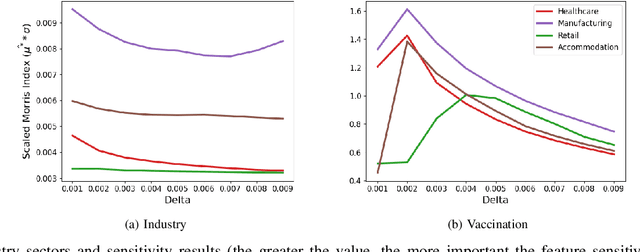
Interpretable machine learning plays a key role in healthcare because it is challenging in understanding feature importance in deep learning model predictions. We propose a novel framework that uses deep learning to study feature sensitivity for model predictions. This work combines sensitivity analysis with heterogeneous time-series deep learning model prediction, which corresponds to the interpretations of spatio-temporal features. We forecast county-level COVID-19 infection using the Temporal Fusion Transformer. We then use the sensitivity analysis extending Morris Method to see how sensitive the outputs are with respect to perturbation to our static and dynamic input features. The significance of the work is grounded in a real-world COVID-19 infection prediction with highly non-stationary, finely granular, and heterogeneous data. 1) Our model can capture the detailed daily changes of temporal and spatial model behaviors and achieves high prediction performance compared to a PyTorch baseline. 2) By analyzing the Morris sensitivity indices and attention patterns, we decipher the meaning of feature importance with observational population and dynamic model changes. 3) We have collected 2.5 years of socioeconomic and health features over 3142 US counties, such as observed cases and deaths, and a number of static (age distribution, health disparity, and industry) and dynamic features (vaccination, disease spread, transmissible cases, and social distancing). Using the proposed framework, we conduct extensive experiments and show our model can learn complex interactions and perform predictions for daily infection at the county level. Being able to model the disease infection with a hybrid prediction and description accuracy measurement with Morris index at the county level is a central idea that sheds light on individual feature interpretation via sensitivity analysis.
Predicting the 2020 US Presidential Election with Twitter
Jul 19, 2021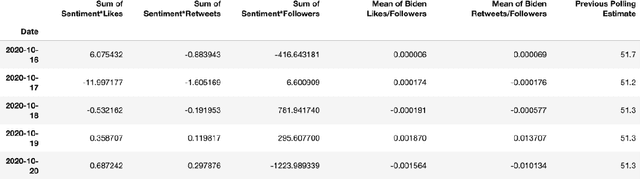
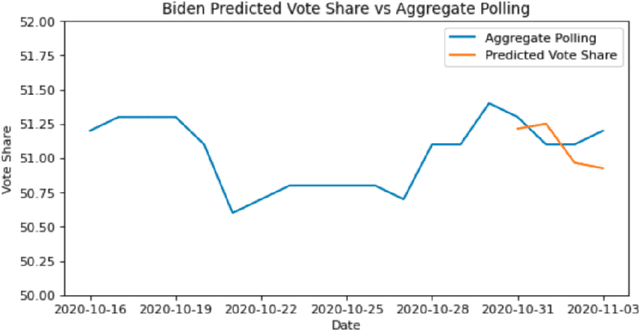
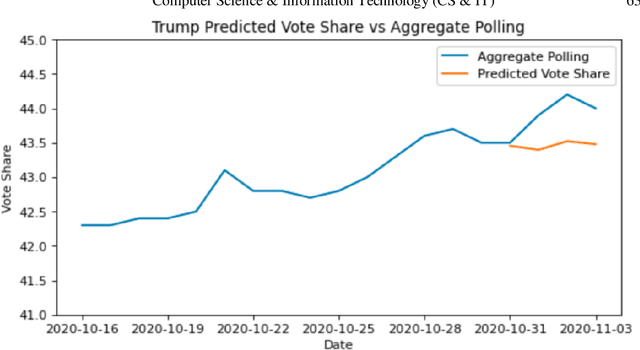
One major sub-domain in the subject of polling public opinion with social media data is electoral prediction. Electoral prediction utilizing social media data potentially would significantly affect campaign strategies, complementing traditional polling methods and providing cheaper polling in real-time. First, this paper explores past successful methods from research for analysis and prediction of the 2020 US Presidential Election using Twitter data. Then, this research proposes a new method for electoral prediction which combines sentiment, from NLP on the text of tweets, and structural data with aggregate polling, a time series analysis, and a special focus on Twitter users critical to the election. Though this method performed worse than its baseline of polling predictions, it is inconclusive whether this is an accurate method for predicting elections due to scarcity of data. More research and more data are needed to accurately measure this method's overall effectiveness.
Transform-Based Multilinear Dynamical System for Tensor Time Series Analysis
Nov 18, 2018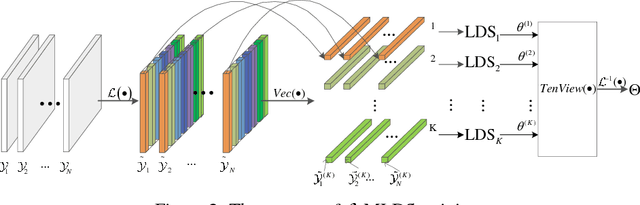
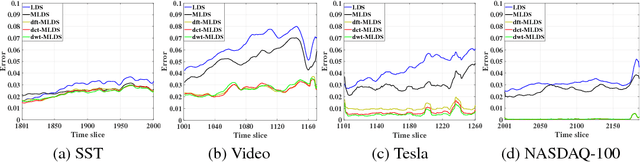
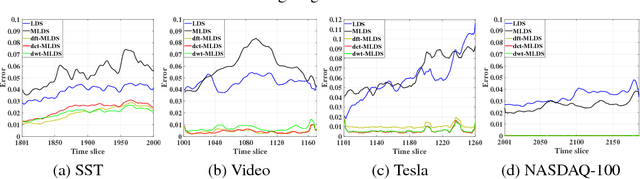
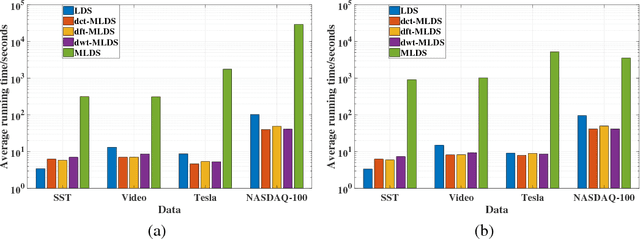
We propose a novel multilinear dynamical system (MLDS) in a transform domain, named $\mathcal{L}$-MLDS, to model tensor time series. With transformations applied to a tensor data, the latent multidimensional correlations among the frontal slices are built, and thus resulting in the computational independence in the transform domain. This allows the exact separability of the multi-dimensional problem into multiple smaller LDS problems. To estimate the system parameters, we utilize the expectation-maximization (EM) algorithm to determine the parameters of each LDS. Further, $\mathcal{L}$-MLDSs significantly reduce the model parameters and allows parallel processing. Our general $\mathcal{L}$-MLDS model is implemented based on different transforms: discrete Fourier transform, discrete cosine transform and discrete wavelet transform. Due to the nonlinearity of these transformations, $\mathcal{L}$-MLDS is able to capture the nonlinear correlations within the data unlike the MLDS \cite{rogers2013multilinear} which assumes multi-way linear correlations. Using four real datasets, the proposed $\mathcal{L}$-MLDS is shown to achieve much higher prediction accuracy than the state-of-the-art MLDS and LDS with an equal number of parameters under different noise models. In particular, the relative errors are reduced by $50\% \sim 99\%$. Simultaneously, $\mathcal{L}$-MLDS achieves an exponential improvement in the model's training time than MLDS.
Multi-Decoder RNN Autoencoder Based on Variational Bayes Method
Apr 29, 2020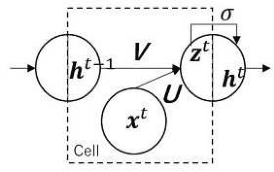
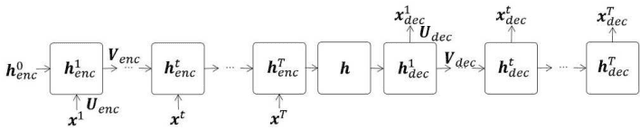
Clustering algorithms have wide applications and play an important role in data analysis fields including time series data analysis. However, in time series analysis, most of the algorithms used signal shape features or the initial value of hidden variable of a neural network. Little has been discussed on the methods based on the generative model of the time series. In this paper, we propose a new clustering algorithm focusing on the generative process of the signal with a recurrent neural network and the variational Bayes method. Our experiments show that the proposed algorithm not only has a robustness against for phase shift, amplitude and signal length variations but also provide a flexible clustering based on the property of the variational Bayes method.
Trustworthy Visual Analytics in Clinical Gait Analysis: A Case Study for Patients with Cerebral Palsy
Aug 10, 2022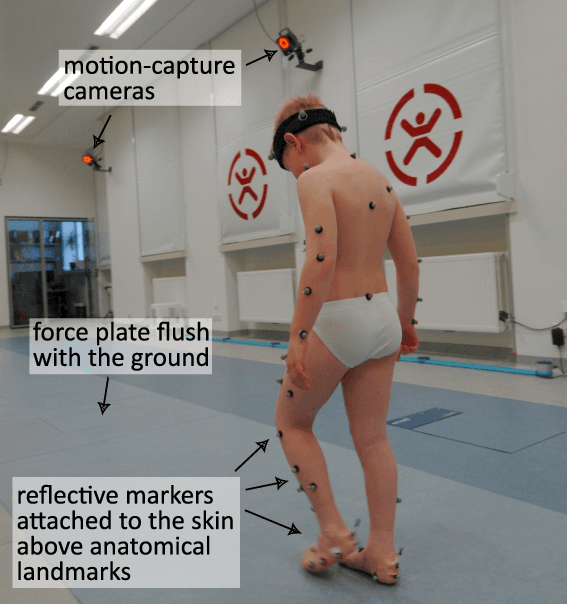
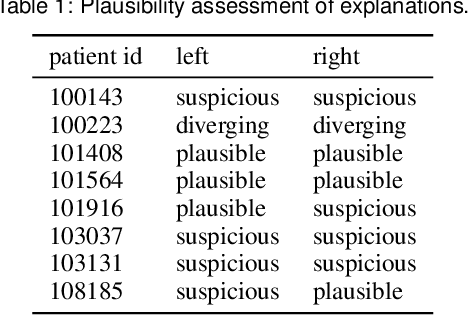
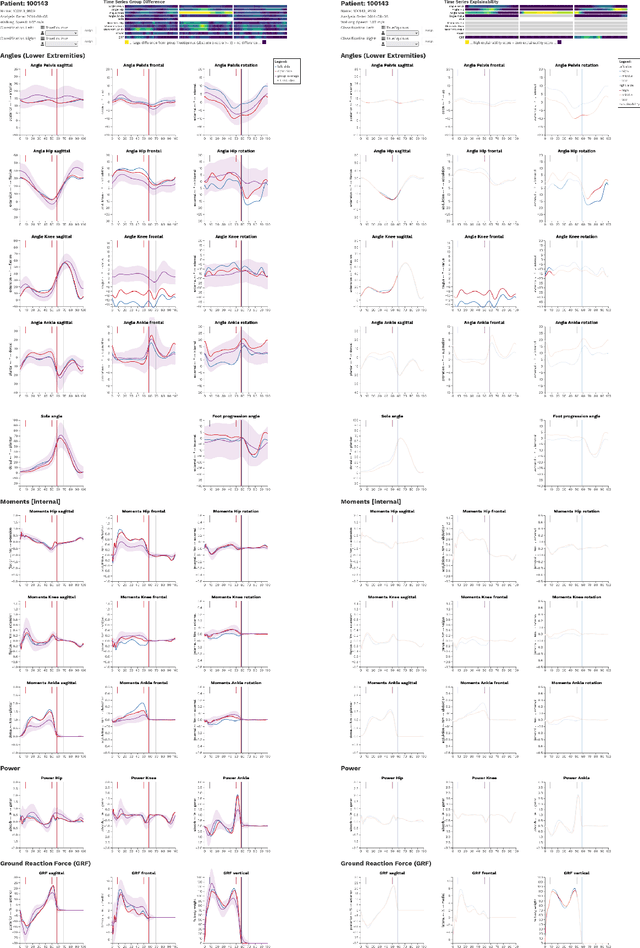
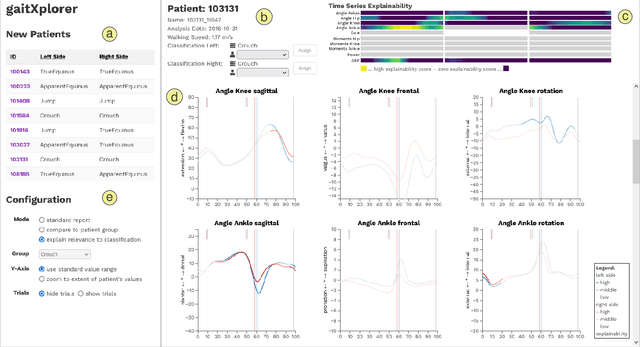
Three-dimensional clinical gait analysis is essential for selecting optimal treatment interventions for patients with cerebral palsy (CP), but generates a large amount of time series data. For the automated analysis of these data, machine learning approaches yield promising results. However, due to their black-box nature, such approaches are often mistrusted by clinicians. We propose gaitXplorer, a visual analytics approach for the classification of CP-related gait patterns that integrates Grad-CAM, a well-established explainable artificial intelligence algorithm, for explanations of machine learning classifications. Regions of high relevance for classification are highlighted in the interactive visual interface. The approach is evaluated in a case study with two clinical gait experts. They inspected the explanations for a sample of eight patients using the visual interface and expressed which relevance scores they found trustworthy and which they found suspicious. Overall, the clinicians gave positive feedback on the approach as it allowed them a better understanding of which regions in the data were relevant for the classification.
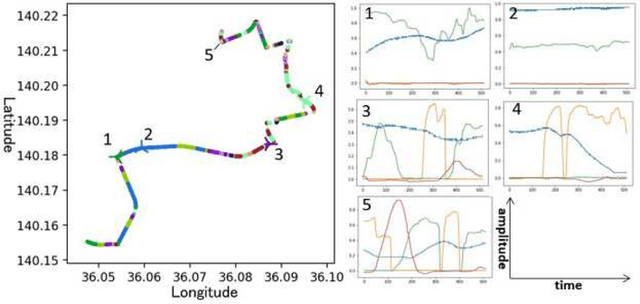
A Data Cube of Big Satellite Image Time-Series for Agriculture Monitoring
May 16, 2022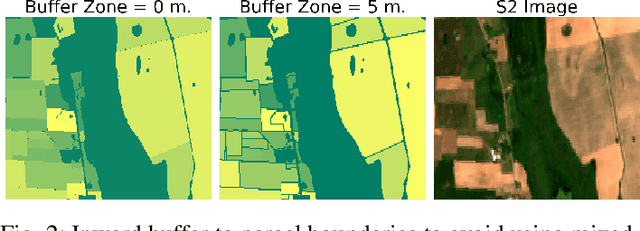

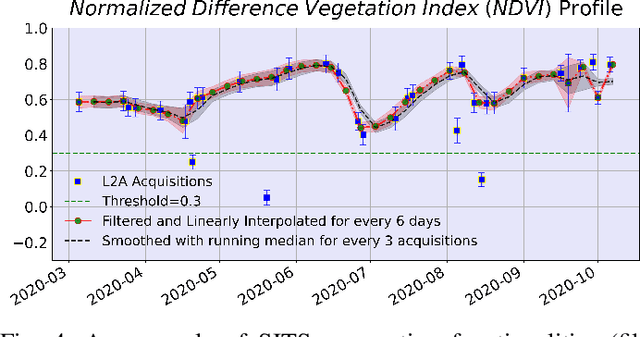
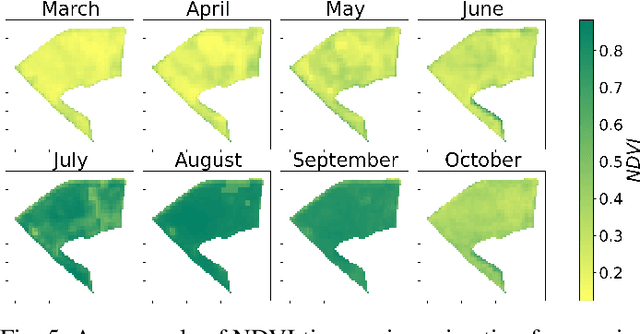
The modernization of the Common Agricultural Policy (CAP) requires the large scale and frequent monitoring of agricultural land. Towards this direction, the free and open satellite data (i.e., Sentinel missions) have been extensively used as the sources for the required high spatial and temporal resolution Earth observations. Nevertheless, monitoring the CAP at large scales constitutes a big data problem and puts a strain on CAP paying agencies that need to adapt fast in terms of infrastructure and know-how. Hence, there is a need for efficient and easy-to-use tools for the acquisition, storage, processing and exploitation of big satellite data. In this work, we present the Agriculture monitoring Data Cube (ADC), which is an automated, modular, end-to-end framework for discovering, pre-processing and indexing optical and Synthetic Aperture Radar (SAR) images into a multidimensional cube. We also offer a set of powerful tools on top of the ADC, including i) the generation of analysis-ready feature spaces of big satellite data to feed downstream machine learning tasks and ii) the support of Satellite Image Time-Series (SITS) analysis via services pertinent to the monitoring of the CAP (e.g., detecting trends and events, monitoring the growth status etc.). The knowledge extracted from the SITS analyses and the machine learning tasks returns to the data cube, building scalable country-specific knowledge bases that can efficiently answer complex and multi-faceted geospatial queries.
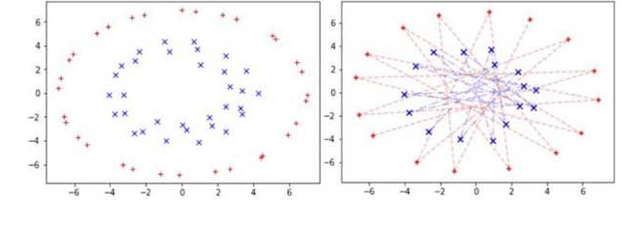
Similarity Preserving Representation Learning for Time Series Analysis
Mar 09, 2017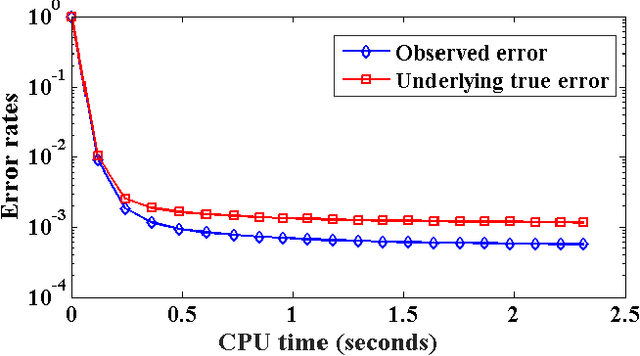
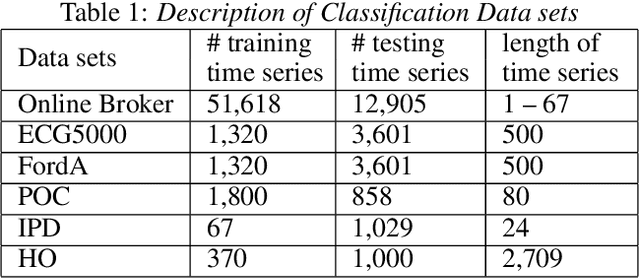
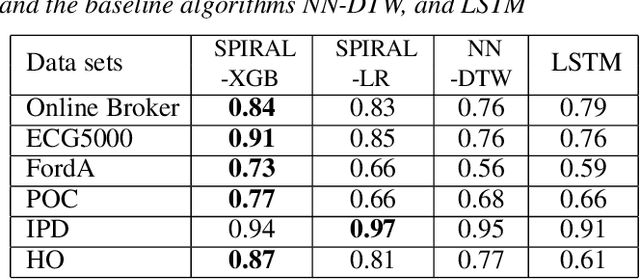
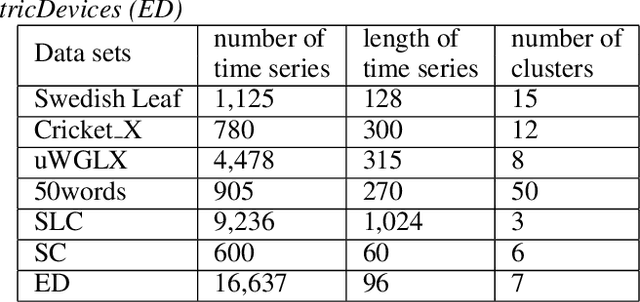
A considerable amount of machine learning algorithms take instance-feature matrices as their inputs. As such, they cannot directly analyze time series data due to its temporal nature, usually unequal lengths, and complex properties. This is a great pity since many of these algorithms are effective, robust, efficient, and easy to use. In this paper, we bridge this gap by proposing an efficient representation learning framework that is able to convert a set of time series with equal or unequal lengths to a matrix format. In particular, we guarantee that the pairwise similarities between time series are well preserved after the transformation. The learned feature representation is particularly suitable to the class of learning problems that are sensitive to data similarities. Given a set of $n$ time series, we first construct an $n\times n$ partially observed similarity matrix by randomly sampling $O(n \log n)$ pairs of time series and computing their pairwise similarities. We then propose an extremely efficient algorithm that solves a highly non-convex and NP-hard problem to learn new features based on the partially observed similarity matrix. We use the learned features to conduct experiments on both data classification and clustering tasks. Our extensive experimental results demonstrate that the proposed framework is both effective and efficient.