 Add to Chrome
 Add to Firefox
 Add to Edge
"Time Series Analysis": models, code, and papers
Interpretable ML-driven Strategy for Automated Trading Pattern Extraction
Mar 23, 2021
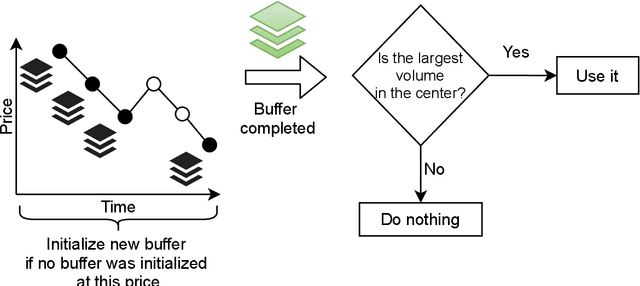
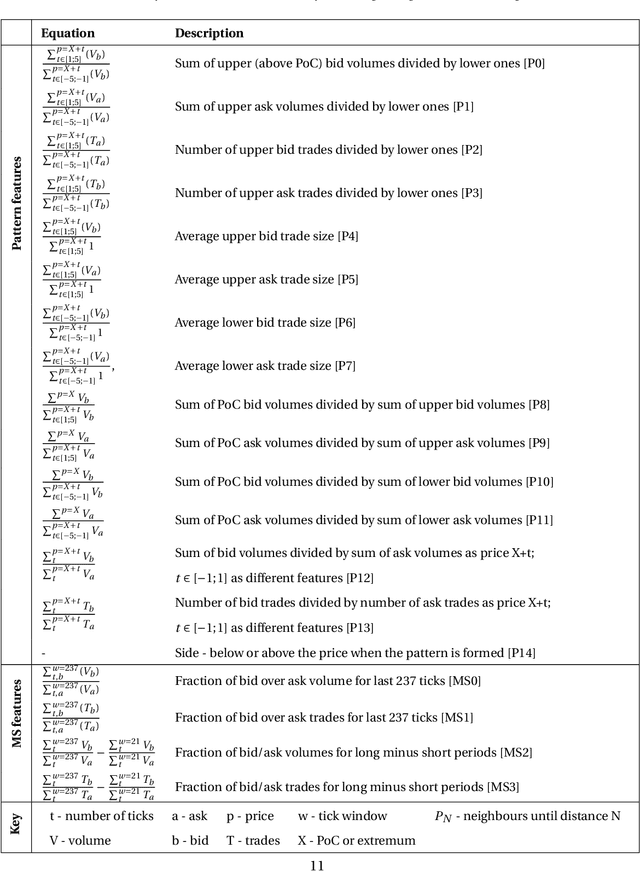
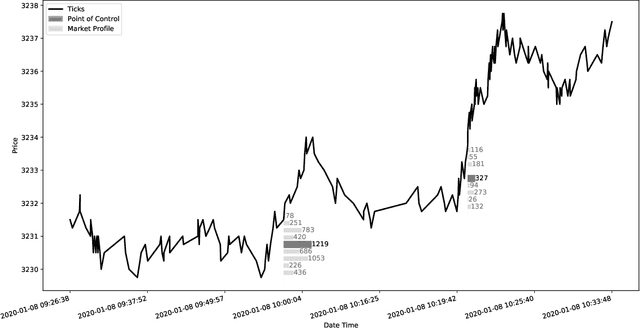
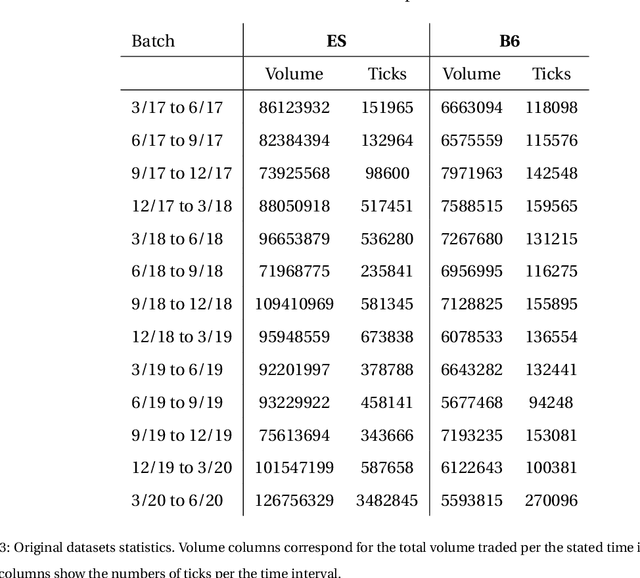
Financial markets are a source of non-stationary multidimensional time series which has been drawing attention for decades. Each financial instrument has its specific changing over time properties, making their analysis a complex task. Improvement of understanding and development of methods for financial time series analysis is essential for successful operation on financial markets. In this study we propose a volume-based data pre-processing method for making financial time series more suitable for machine learning pipelines. We use a statistical approach for assessing the performance of the method. Namely, we formally state the hypotheses, set up associated classification tasks, compute effect sizes with confidence intervals, and run statistical tests to validate the hypotheses. We additionally assess the trading performance of the proposed method on historical data and compare it to a previously published approach. Our analysis shows that the proposed volume-based method allows successful classification of the financial time series patterns, and also leads to better classification performance than a price action-based method, excelling specifically on more liquid financial instruments. Finally, we propose an approach for obtaining feature interactions directly from tree-based models on example of CatBoost estimator, as well as formally assess the relatedness of the proposed approach and SHAP feature interactions with a positive outcome.
Interpretable Super-Resolution via a Learned Time-Series Representation
Jun 13, 2020
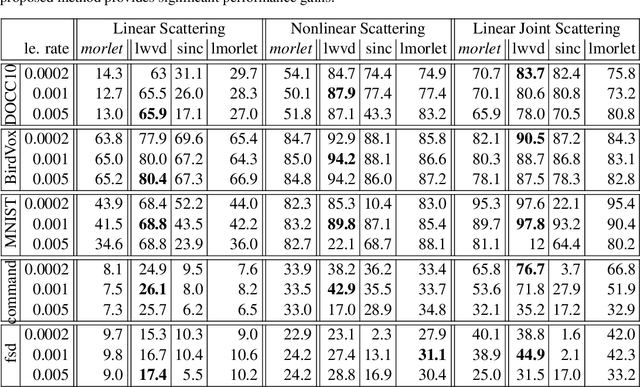
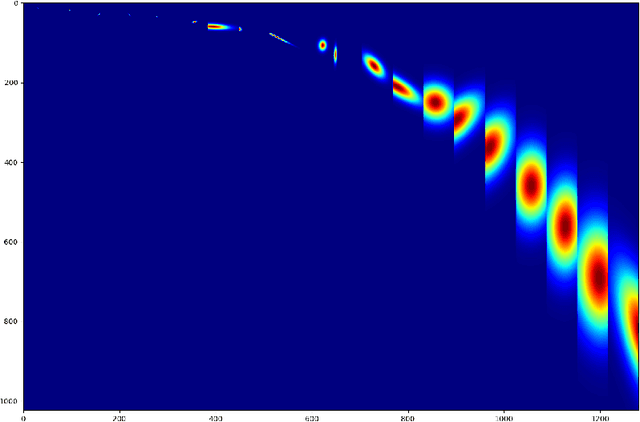
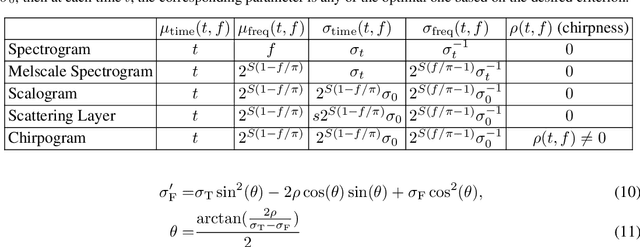
We develop an interpretable and learnable Wigner-Ville distribution that produces a super-resolved quadratic signal representation for time-series analysis. Our approach has two main hallmarks. First, it interpolates between known time-frequency representations (TFRs) in that it can reach super-resolution with increased time and frequency resolution beyond what the Heisenberg uncertainty principle prescribes and thus beyond commonly employed TFRs, Second, it is interpretable thanks to an explicit low-dimensional and physical parameterization of the Wigner-Ville distribution. We demonstrate that our approach is able to learn highly adapted TFRs and is ready and able to tackle various large-scale classification tasks, where we reach state-of-the-art performance compared to baseline and learned TFRs.
Enhancing Cancer Prediction in Challenging Screen-Detected Incident Lung Nodules Using Time-Series Deep Learning
Mar 30, 2022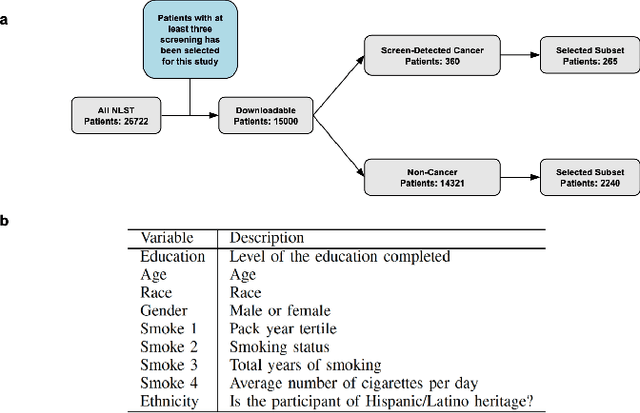
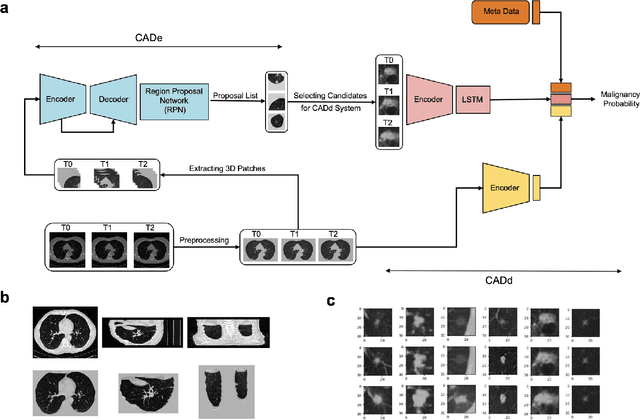
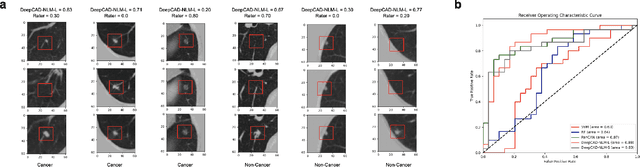
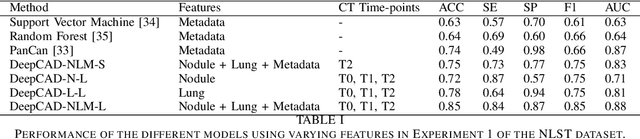
Lung cancer is the leading cause of cancer-related mortality worldwide. Lung cancer screening (LCS) using annual low-dose computed tomography (CT) scanning has been proven to significantly reduce lung cancer mortality by detecting cancerous lung nodules at an earlier stage. Improving risk stratification of malignancy risk in lung nodules can be enhanced using machine/deep learning algorithms. However most existing algorithms: a) have primarily assessed single time-point CT data alone thereby failing to utilize the inherent advantages contained within longitudinal imaging datasets; b) have not integrated into computer models pertinent clinical data that might inform risk prediction; c) have not assessed algorithm performance on the spectrum of nodules that are most challenging for radiologists to interpret and where assistance from analytic tools would be most beneficial. Here we show the performance of our time-series deep learning model (DeepCAD-NLM-L) which integrates multi-model information across three longitudinal data domains: nodule-specific, lung-specific, and clinical demographic data. We compared our time-series deep learning model to a) radiologist performance on CTs from the National Lung Screening Trial enriched with the most challenging nodules for diagnosis; b) a nodule management algorithm from a North London LCS study (SUMMIT). Our model demonstrated comparable and complementary performance to radiologists when interpreting challenging lung nodules and showed improved performance (AUC=88\%) against models utilizing single time-point data only. The results emphasise the importance of time-series, multi-modal analysis when interpreting malignancy risk in LCS.
Imaging the time series of one single referenced EEG electrode for Epileptic Seizures Risk Analysis
Jun 29, 2022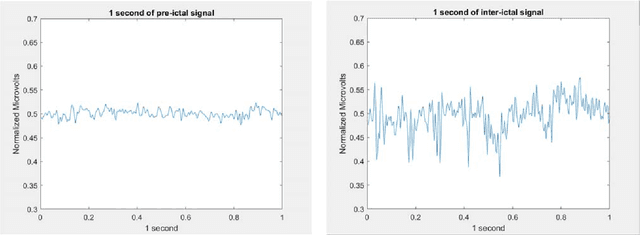
The time series captured by a single scalp electrode (plus the reference electrode) of refractory epileptic patients is used to forecast seizures susceptibility. The time series is preprocessed, segmented, and each segment transformed into an image, using three different known methods: Recurrence Plot, Gramian Angular Field, Markov Transition Field. The likelihood of the occurrence of a seizure in a future predefined time window is computed by averaging the output of the softmax layer of a CNN, differently from the usual consideration of the output of the classification layer. By thresholding this likelihood, seizure forecasting has better performance. Interestingly, for almost every patient, the best threshold was different from 50%. The results show that this technique can predict with good results for some seizures and patients. However, more tests, namely more patients and more seizures, are needed to better understand the real potential of this technique.
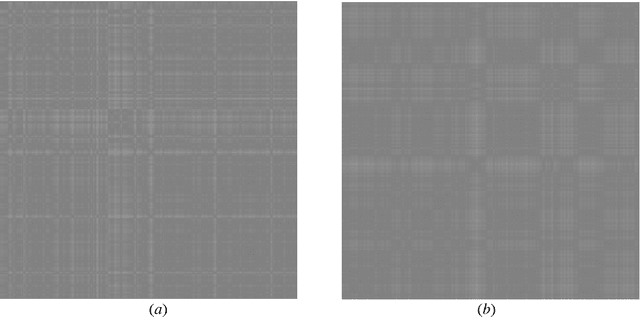
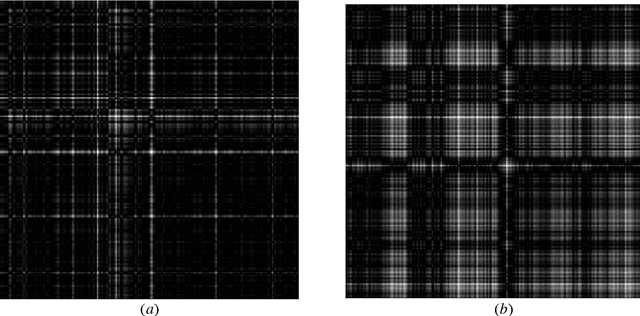
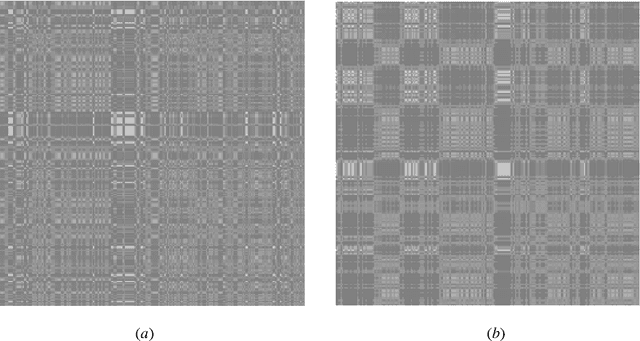
A fast algorithm for complex discord searches in time series: HOT SAX Time
Jan 26, 2021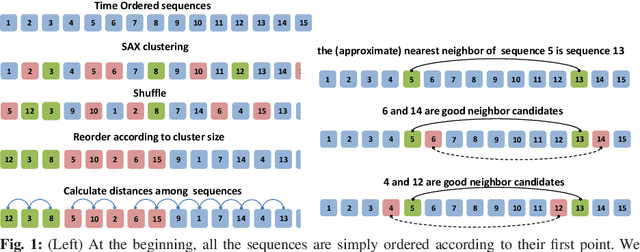
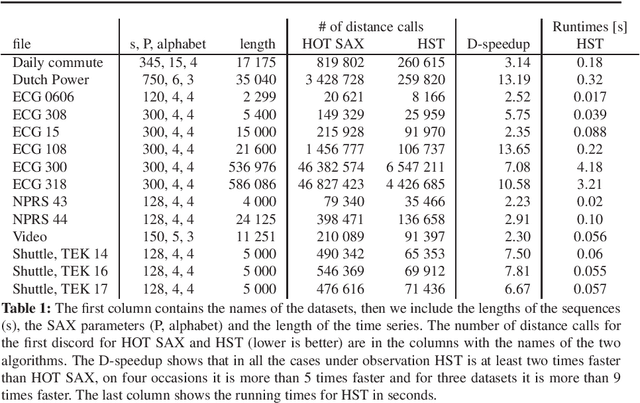
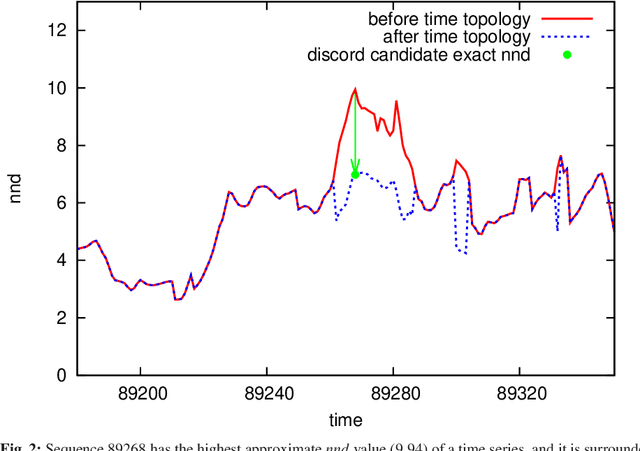
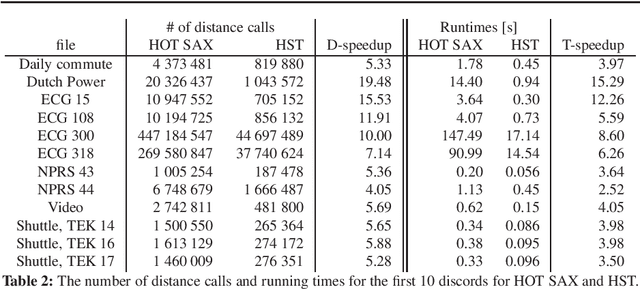
Time series analysis is quickly proceeding towards long and complex tasks. In recent years, fast approximate algorithms for discord search have been proposed in order to compensate for the increasing size of the time series. It is more interesting, however, to find quick exact solutions. In this research, we improved HOT SAX by exploiting two main ideas: the warm-up process, and the similarity between sequences close in time. The resulting algorithm, called HOT SAX Time (HST), has been validated with real and synthetic time series, and successfully compared with HOT SAX, RRA, SCAMP, and DADD. The complexity of a discord search has been evaluated with a new indicator, the cost per sequence (cps), which allows one to compare searches on time series of different lengths. Numerical evidence suggests that two conditions are involved in determining the complexity of a discord search in a non-trivial way: the length of the discords, and the noise/signal ratio. In the case of complex searches, HST can be more than 100 times faster than HOT SAX, thus being at the forefront of the exact discord search.
Application of Gaussian Process Regression to Koopman Mode Decomposition for Noisy Dynamic Data
Nov 14, 2019
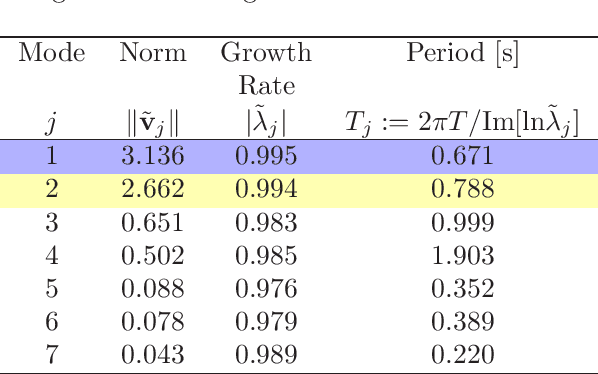
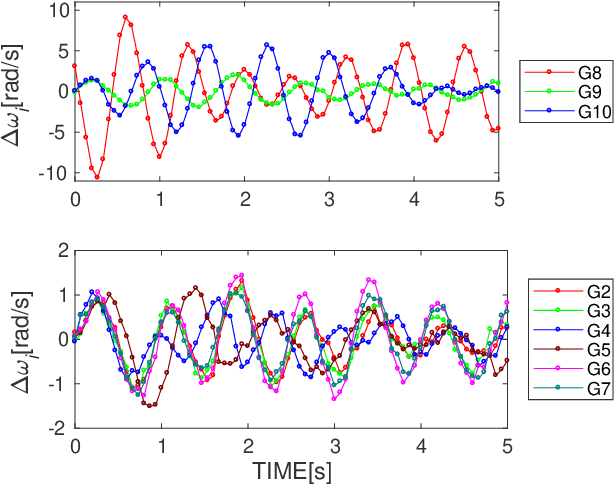
Koopman Mode Decomposition (KMD) is a technique of nonlinear time-series analysis that originates from point spectrum of the Koopman operator defined for an underlying nonlinear dynamical system. We present a numerical algorithm of KMD based on Gaussian process regression that is capable of handling noisy finite-time data. The algorithm is applied to short-term swing dynamics of a multi-machine power grid in order to estimate oscillatory modes embedded in the dynamics, and thereby the effectiveness of the algorithm is evaluated.
A Consistent Independence Test for Multivariate Time-Series
Aug 18, 2019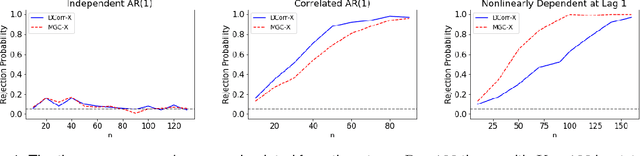
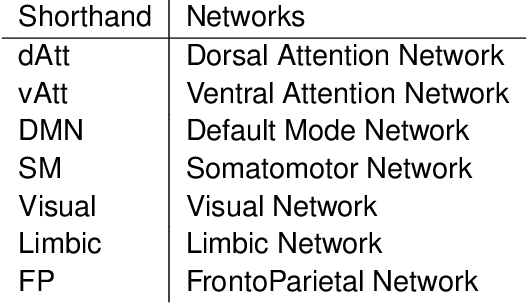
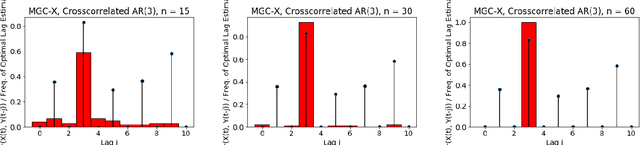
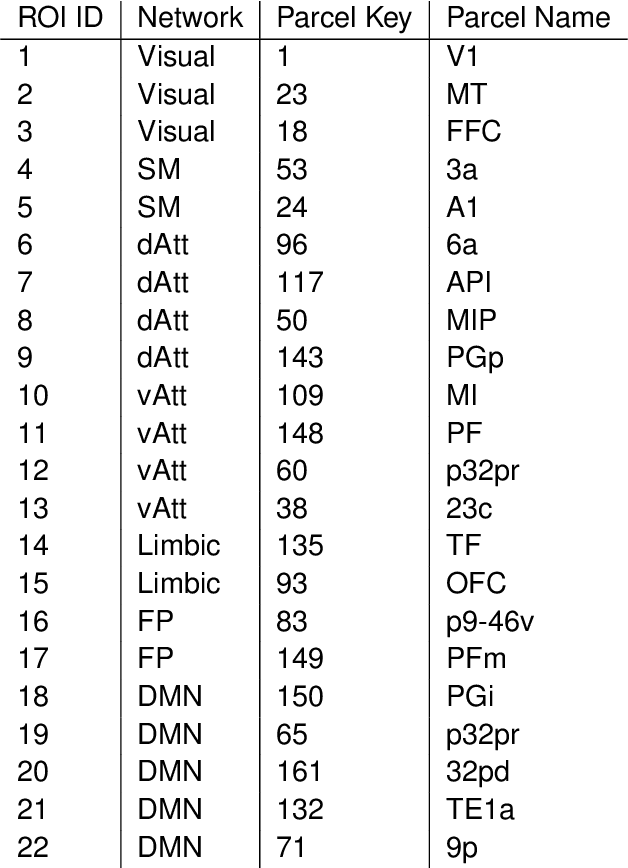
A fundamental problem in statistical data analysis is testing whether two phenomena are related. When the phenomena in question are time series, many challenges emerge. The first is defining a dependence measure between time series at the population level, as well as a sample level test statistic. The second is computing or estimating the distribution of this test statistic under the null, as the permutation test procedure is invalid for most time series structures. This work aims to address these challenges by combining distance correlation and multiscale graph correlation (MGC) from independence testing literature and block permutation testing from time series analysis. Two hypothesis tests for testing the independence of time series are proposed. These procedures also characterize whether the dependence relationship between the series is linear or nonlinear, and the time lag at which this dependence is maximized. For strictly stationary auto-regressive moving average (ARMA) processes, the proposed independence tests are proven valid and consistent. Finally, neural connectivity in the brain is analyzed using fMRI data, revealing linear dependence of signals within the visual network and default mode network, and nonlinear relationships in other regions. This work opens up new theoretical and practical directions for many modern time series analysis problems.
RTFN: Robust Temporal Feature Network
Aug 18, 2020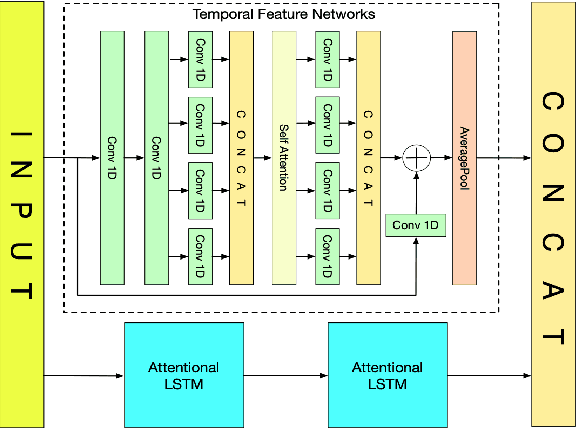
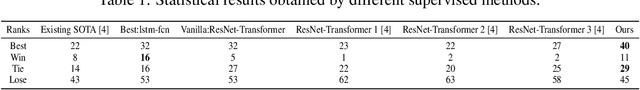
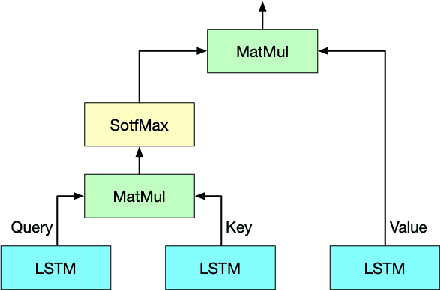
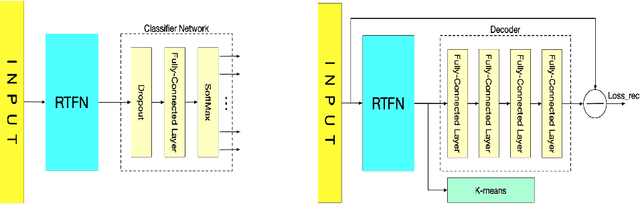
Time series analysis plays a vital role in various applications, for instance, healthcare, weather prediction, disaster forecast, etc. However, to obtain sufficient shapelets by a feature network is still challenging. To this end, we propose a novel robust temporal feature network (RTFN) that contains temporal feature networks and attentional LSTM networks. The temporal feature networks are built to extract basic features from input data while the attentional LSTM networks are devised to capture complicated shapelets and relationships to enrich features. In experiments, we embed RTFN into supervised structure as a feature extraction network and into unsupervised clustering as an encoder, respectively. The results show that the RTFN-based supervised structure is a winner of 40 out of 85 datasets and the RTFN-based unsupervised clustering performs the best on 4 out of 11 datasets in the UCR2018 archive.
Path Signatures on Lie Groups
Jul 15, 2020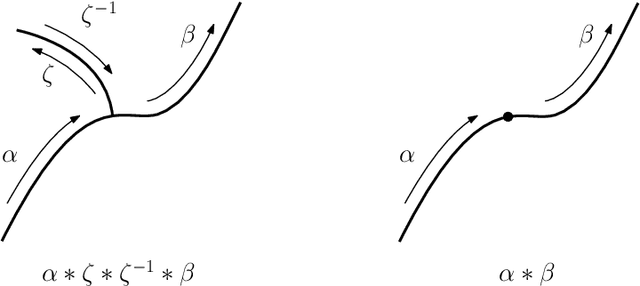
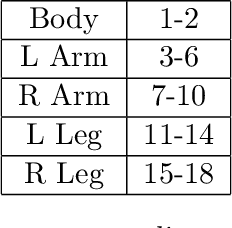
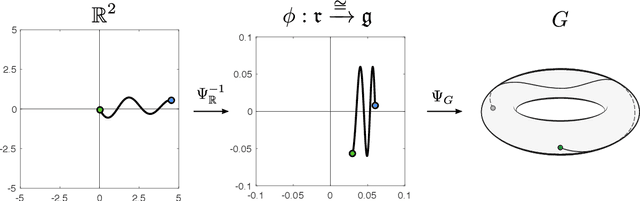
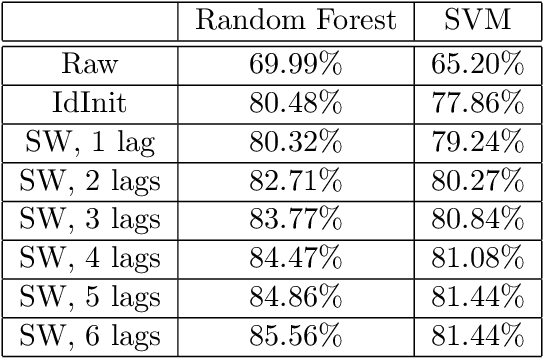
Path signatures are powerful nonparametric tools for time series analysis, shown to form a universal and characteristic feature map for Euclidean valued time series data. We lift the theory of path signatures to the setting of Lie group valued time series, adapting these tools for time series with underlying geometric constraints. We prove that this generalized path signature is universal and characteristic. To demonstrate universality, we analyze the human action recognition problem in computer vision, using $SO(3)$ representations for the time series, providing comparable performance to other shallow learning approaches, while offering an easily interpretable feature set. We also provide a two-sample hypothesis test for Lie group-valued random walks to illustrate its characteristic property. Finally we provide algorithms and a Julia implementation of these methods.