 Add to Chrome
 Add to Firefox
 Add to Edge
"Time Series Analysis": models, code, and papers
A methodology for identifying resiliency in renewable electrical distribution system using complex network
Aug 24, 2022
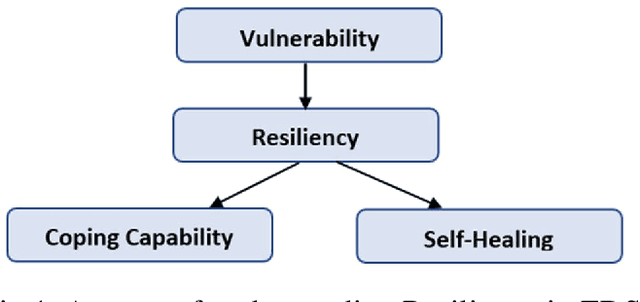
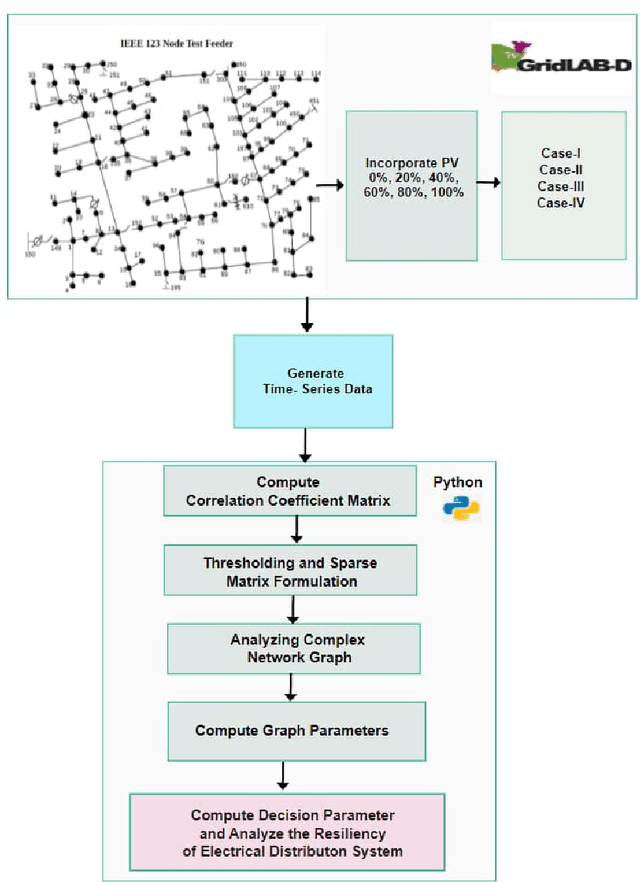
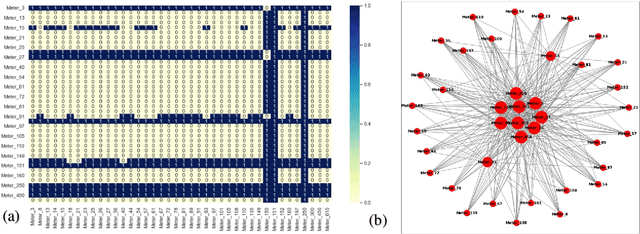
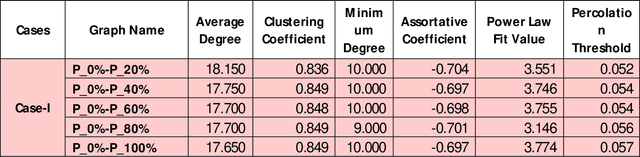
Recently, Electrical Distribution Systems are extensively penetrated with the Distributed Energy Resources (DERs) to cater the energy demands with general perception that it enhances the system resiliency. However, it may be adverse for the grid operation due to various factors like its intermittent availability, dynamics in weather condition, introduction of nonlinearity, complexity etc. This needs a detailed understanding of system resiliency that our method proposes here. We introduce a methodology using complex network theory to identify the resiliency of distribution system when incorporated with Solar PV generation under various undesirable configurations. Complex correlated networks for different conditions were obtained and various network parameters were computed for identifying the resiliency of those networks. The proposed methodology identifies the hosting capacity of solar panels in the system while maintaining the resiliency under different unwanted conditions hence helps to obtain an optimal allocation topology for solar panels in the system. The proposed method also identifies the critical nodes that are highly sensitive to the changes and could drive the system into non-resiliency. This framework was demonstrated on IEEE-123 Test Feeder system with time-series data generated using GridLAB-D and variety of analysis were performed using complex network and machine learning models.
Automated data-driven approach for gap filling in the time series using evolutionary learning
Mar 01, 2021
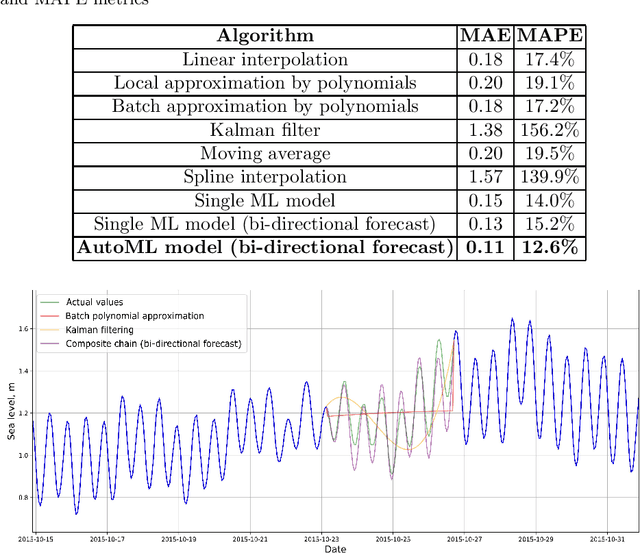
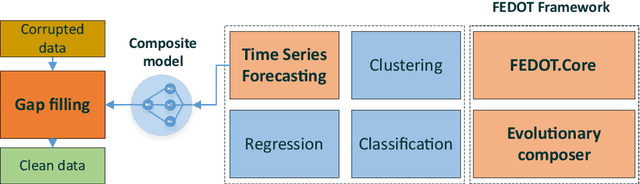
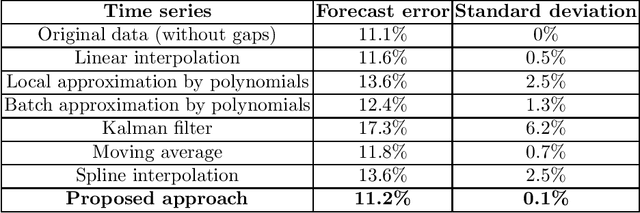
Time series analysis is widely used in various fields of science and industry. However, the vast majority of the time series obtained from real sources contain a large number of gaps, have a complex character, and can contain incorrect or missed parts. So, it is useful to have a convenient, efficient, and flexible instrument to fill the gaps in the time series. In this paper, we propose an approach for filling the gaps by the evolutionary automatic machine learning, that is implemented as a part of the FEDOT framework. Automated identification of the optimal data-driven model structure allows the adopting of the gap filling strategy to the specific problem. As a case study, the multivariate sea surface height dataset is used. During the experimental studies, the proposed approach was compared with other gap-filling methods and the composite models allow obtaining the higher quality of the gap restoration.
Topological Data Analysis in Time Series: Temporal Filtration and Application to Single-Cell Genomics
Apr 29, 2022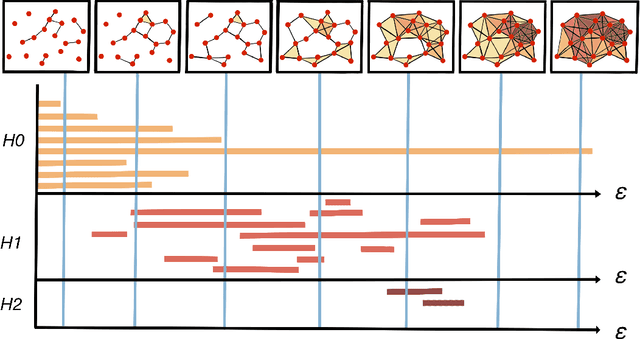
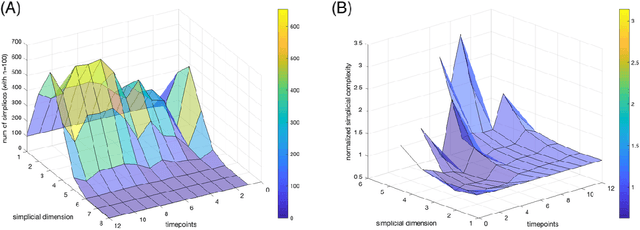
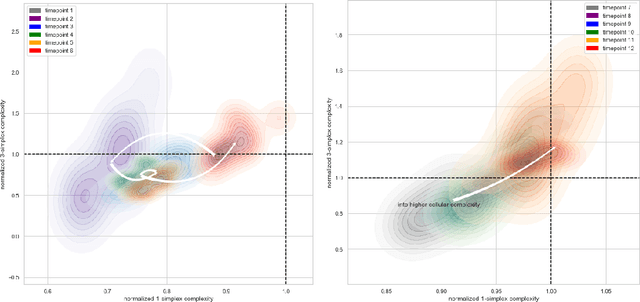
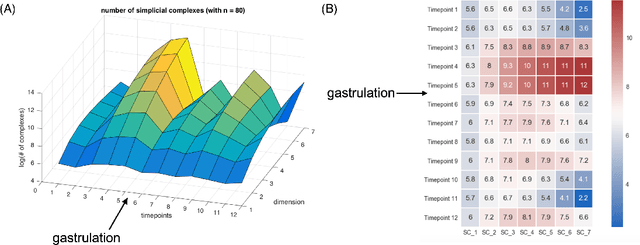
The absence of a conventional association between the cell-cell cohabitation and its emergent dynamics into cliques during development has hindered our understanding of how cell populations proliferate, differentiate, and compete, i.e. the cell ecology. With the recent advancement of the single-cell RNA-sequencing (RNA-seq), we can potentially describe such a link by constructing network graphs that characterize the similarity of the gene expression profiles of the cell-specific transcriptional programs, and analyzing these graphs systematically using the summary statistics informed by the algebraic topology. We propose the single-cell topological simplicial analysis (scTSA). Applying this approach to the single-cell gene expression profiles from local networks of cells in different developmental stages with different outcomes reveals a previously unseen topology of cellular ecology. These networks contain an abundance of cliques of single-cell profiles bound into cavities that guide the emergence of more complicated habitation forms. We visualize these ecological patterns with topological simplicial architectures of these networks, compared with the null models. Benchmarked on the single-cell RNA-seq data of zebrafish embryogenesis spanning 38,731 cells, 25 cell types and 12 time steps, our approach highlights the gastrulation as the most critical stage, consistent with consensus in developmental biology. As a nonlinear, model-independent, and unsupervised framework, our approach can also be applied to tracing multi-scale cell lineage, identifying critical stages, or creating pseudo-time series.
Linear, Machine Learning and Probabilistic Approaches for Time Series Analysis
Feb 26, 2017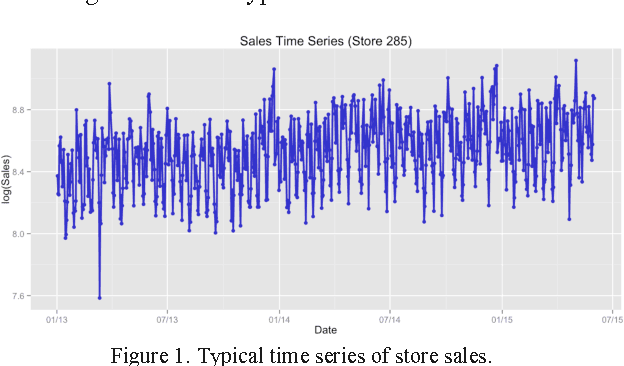
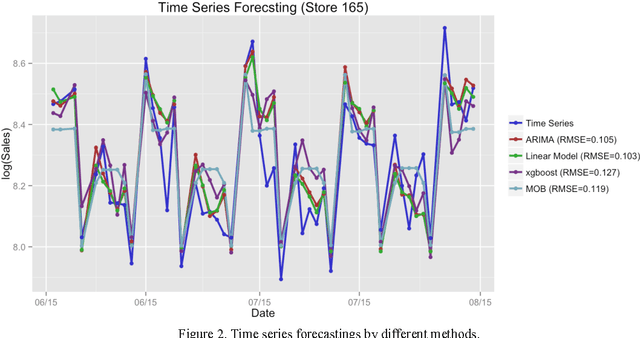
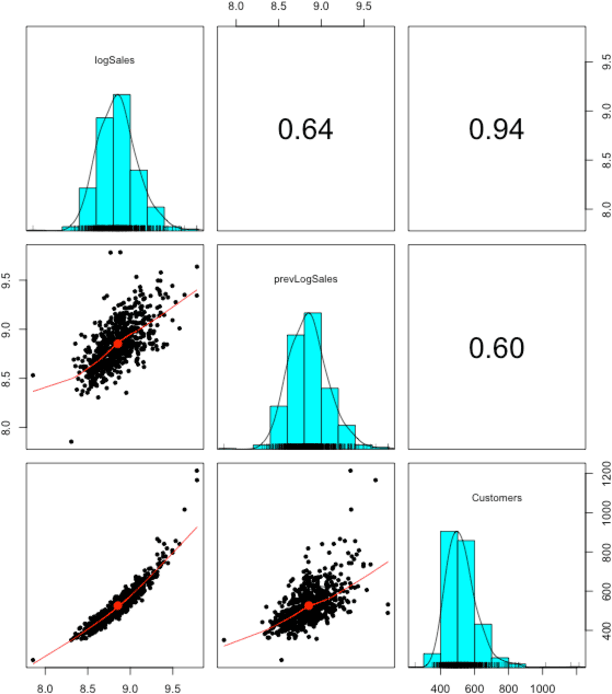
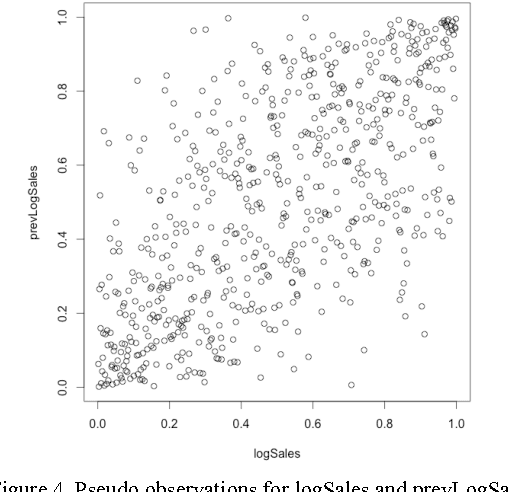
In this paper we study different approaches for time series modeling. The forecasting approaches using linear models, ARIMA alpgorithm, XGBoost machine learning algorithm are described. Results of different model combinations are shown. For probabilistic modeling the approaches using copulas and Bayesian inference are considered.
Early Abandoning and Pruning for Elastic Distances
Feb 10, 2021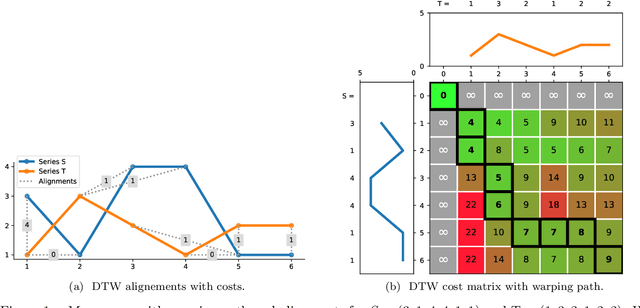
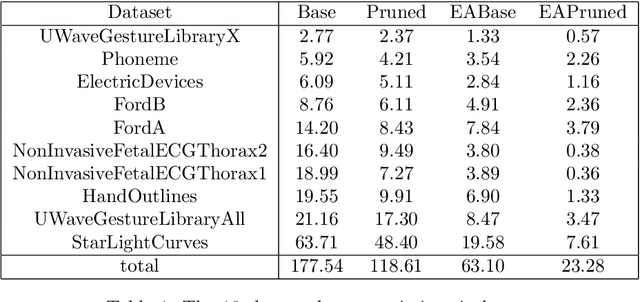
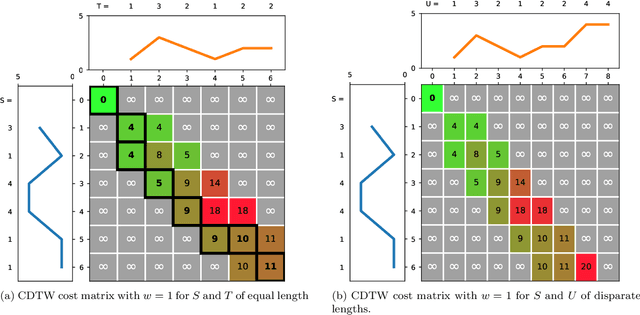
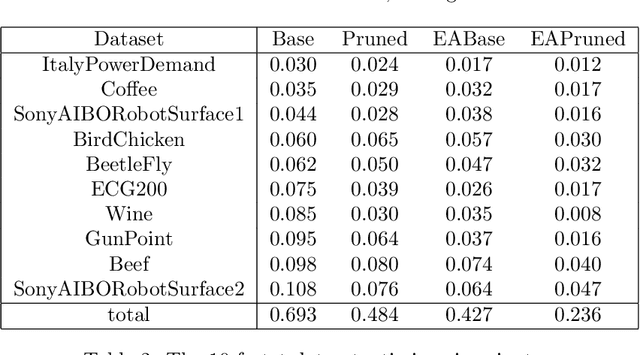
Elastic distances are key tools for time series analysis. Straightforward implementations require O(n2)space and time complexities, preventing many applications from scaling to long series. Much work hasbeen devoted in speeding up these applications, mostly with the development of lower bounds, allowing to avoid costly distance computations when a given threshold is exceeded. This threshold also allows to early abandon the computation of the distance itself. Another approach, developed for DTW, is to prune parts of the computation. All these techniques are orthogonal to each other. In this work, we develop a new generic strategy, "EAPruned", that tightly integrates pruning with early abandoning. We apply it to DTW, CDTW, WDTW, ERP, MSM and TWE, showing substantial speedup in NN1-like scenarios. Pruning also shows substantial speedup for some distances, benefiting applications such as clustering where all pairwise distances are required and hence early abandoning is not applicable. We release our implementation as part of a new C++ library for time series classification, along with easy to usePython/Numpy bindings.
Causal Analysis of Generic Time Series Data Applied for Market Prediction
Apr 22, 2022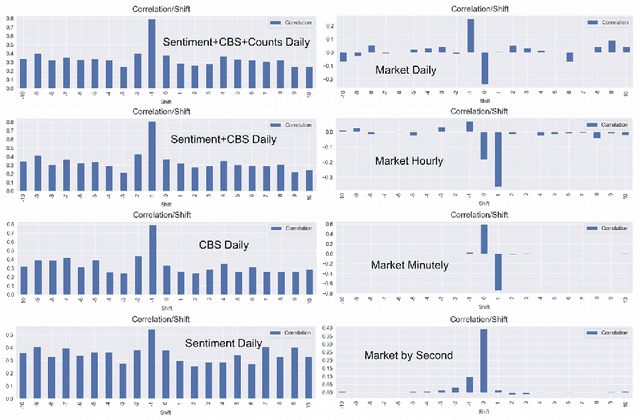
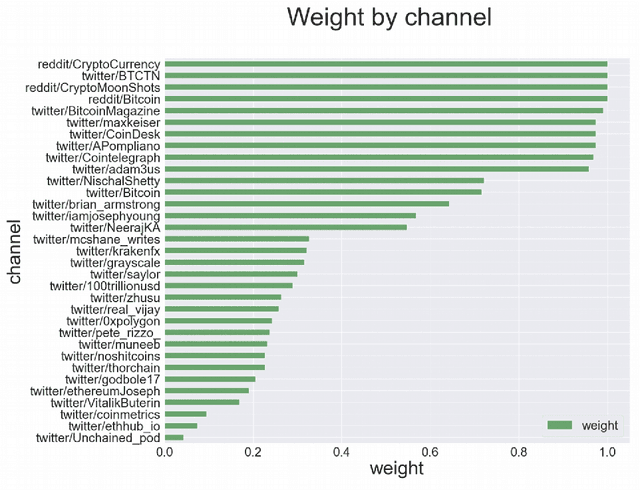
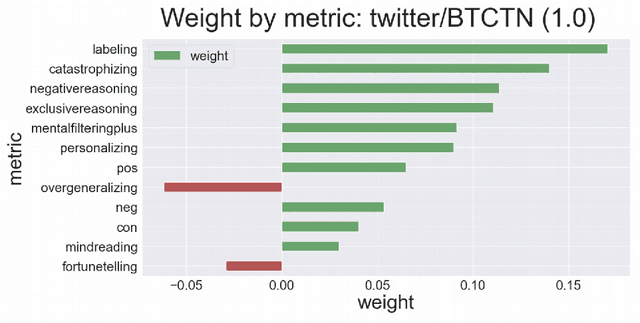
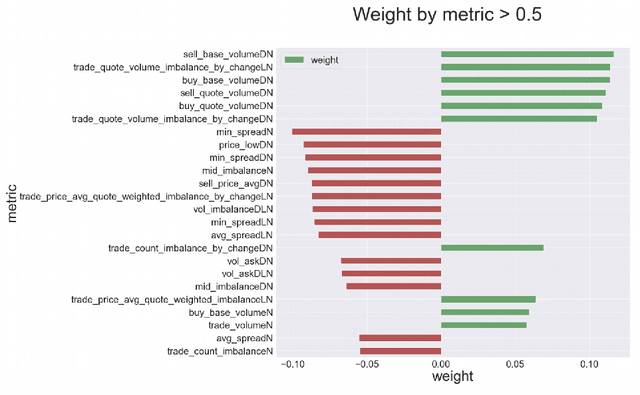
We explore the applicability of the causal analysis based on temporally shifted (lagged) Pearson correlation applied to diverse time series of different natures in context of the problem of financial market prediction. Theoretical discussion is followed by description of the practical approach for specific environment of time series data with diverse nature and sparsity, as applied for environments of financial markets. The data involves various financial metrics computable from raw market data such as real-time trades and snapshots of the limit order book as well as metrics determined upon social media news streams such as sentiment and different cognitive distortions. The approach is backed up with presentation of algorithmic framework for data acquisition and analysis, concluded with experimental results, and summary pointing out at the possibility to discriminate causal connections between different sorts of real field market data with further discussion on present issues and possible directions of the following work.
Network Modulation Synthesis: New Algorithms for Generating Musical Audio Using Autoencoder Networks
Sep 04, 2021
A new framework is presented for generating musical audio using autoencoder neural networks. With the presented framework, called network modulation synthesis, users can create synthesis architectures and use novel generative algorithms to more easily move through the complex latent parameter space of an autoencoder model to create audio. Implementations of the new algorithms are provided for the open-source CANNe synthesizer network, and can be applied to other autoencoder networks for audio synthesis. Spectrograms and time-series encoding analysis demonstrate that the new algorithms provide simple mechanisms for users to generate time-varying parameter combinations, and therefore auditory possibilities, that are difficult to create by generating audio from handcrafted encodings.
Prediction of Hilbertian autoregressive processes : a Recurrent Neural Network approach
Aug 25, 2020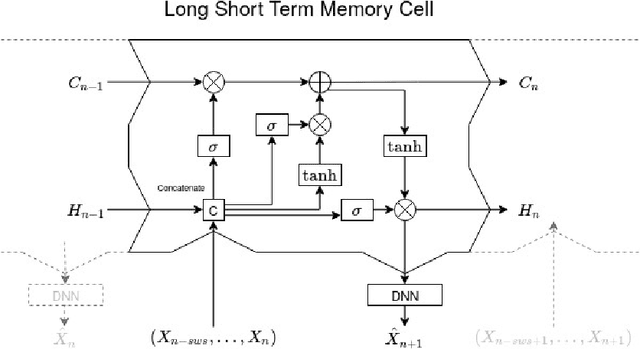
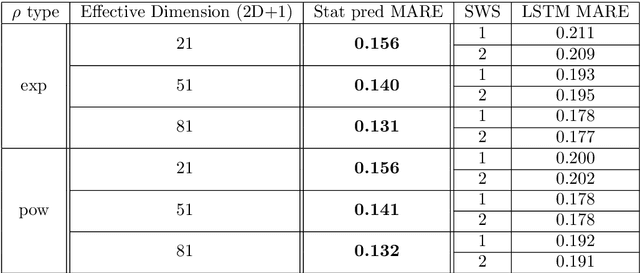
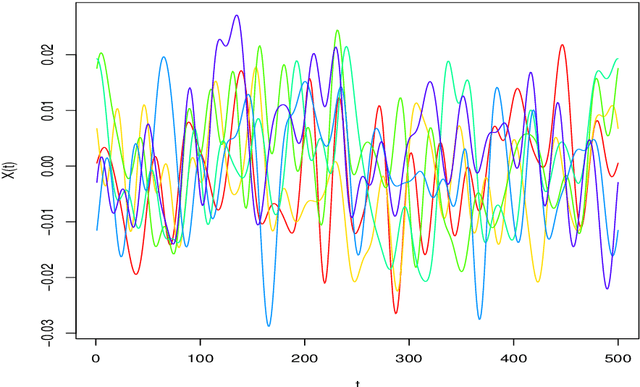
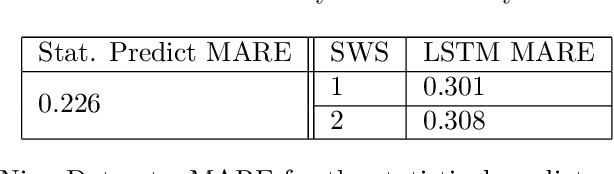
The autoregressive Hilbertian model (ARH) was introduced in the early 90's by Denis Bosq. It was the subject of a vast literature and gave birth to numerous extensions. The model generalizes the classical multidimensional autoregressive model, widely used in Time Series Analysis. It was successfully applied in numerous fields such as finance, industry, biology. We propose here to compare the classical prediction methodology based on the estimation of the autocorrelation operator with a neural network learning approach. The latter is based on a popular version of Recurrent Neural Networks : the Long Short Term Memory networks. The comparison is carried out through simulations and real datasets.
Robust multivariate and functional archetypal analysis with application to financial time series analysis
Oct 01, 2018
Archetypal analysis approximates data by means of mixtures of actual extreme cases (archetypoids) or archetypes, which are a convex combination of cases in the data set. Archetypes lie on the boundary of the convex hull. This makes the analysis very sensitive to outliers. A robust methodology by means of M-estimators for classical multivariate and functional data is proposed. This unsupervised methodology allows complex data to be understood even by non-experts. The performance of the new procedure is assessed in a simulation study, where a comparison with a previous methodology for the multivariate case is also carried out, and our proposal obtains favorable results. Finally, robust bivariate functional archetypoid analysis is applied to a set of companies in the S\&P 500 described by two time series of stock quotes. A new graphic representation is also proposed to visualize the results. The analysis shows how the information can be easily interpreted and how even non-experts can gain a qualitative understanding of the data.
District Wise Price Forecasting of Wheat in Pakistan using Deep Learning
Mar 05, 2021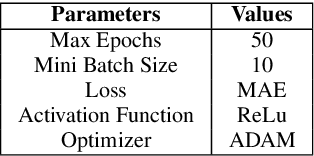
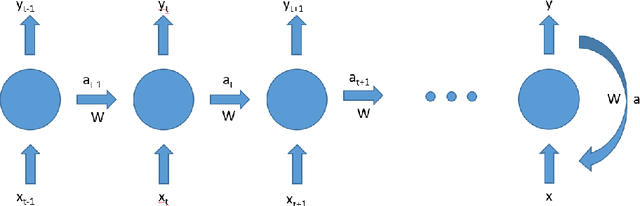
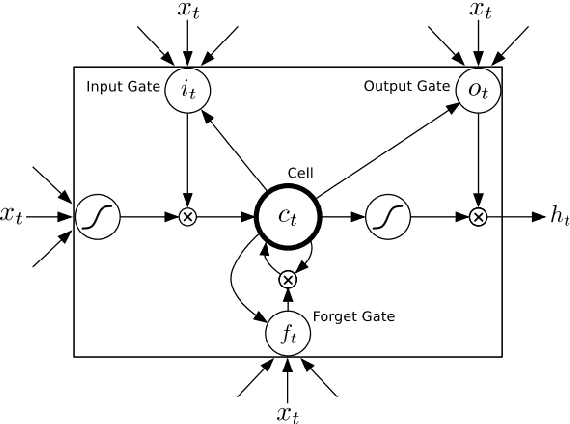
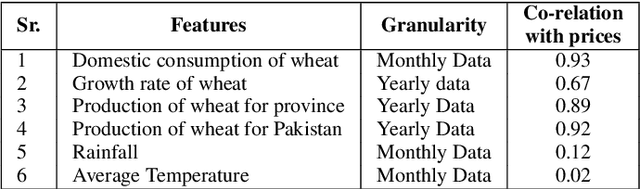
Wheat is the main agricultural crop of Pakistan and is a staple food requirement of almost every Pakistani household making it the main strategic commodity of the country whose availability and affordability is the government's main priority. Wheat food availability can be vastly affected by multiple factors included but not limited to the production, consumption, financial crisis, inflation, or volatile market. The government ensures food security by particular policy and monitory arrangements, which keeps up purchase parity for the poor. Such arrangements can be made more effective if a dynamic analysis is carried out to estimate the future yield based on certain current factors. Future planning of commodity pricing is achievable by forecasting their future price anticipated by the current circumstances. This paper presents a wheat price forecasting methodology, which uses the price, weather, production, and consumption trends for wheat prices taken over the past few years and analyzes them with the help of advance neural networks architecture Long Short Term Memory (LSTM) networks. The proposed methodology presented significantly improved results versus other conventional machine learning and statistical time series analysis methods.