 Add to Chrome
 Add to Firefox
 Add to Edge
"Time Series Analysis": models, code, and papers
Human activity recognition based on time series analysis using U-Net
Sep 20, 2018
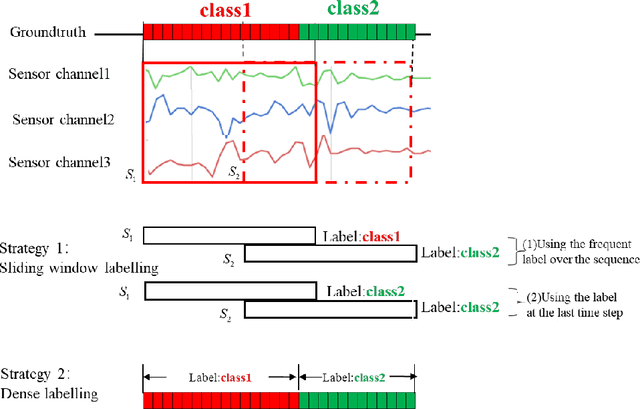
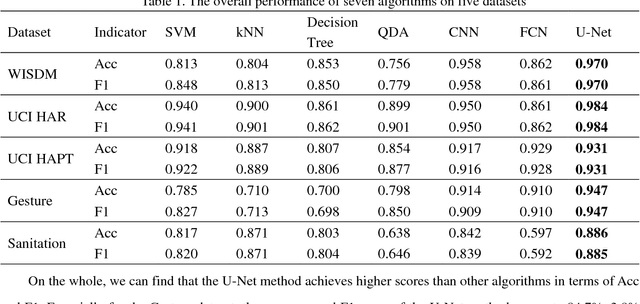
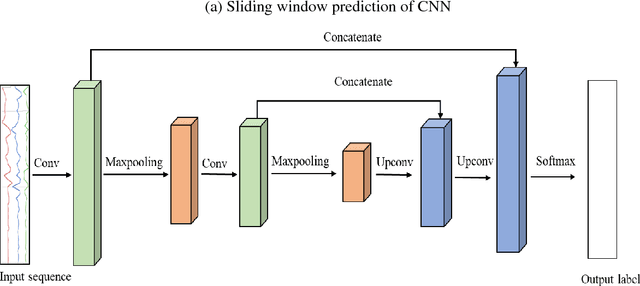
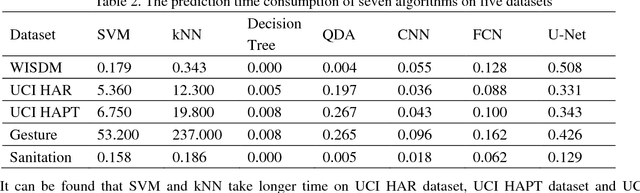
Traditional human activity recognition (HAR) based on time series adopts sliding window analysis method. This method faces the multi-class window problem which mistakenly labels different classes of sampling points within a window as a class. In this paper, a HAR algorithm based on U-Net is proposed to perform activity labeling and prediction at each sampling point. The activity data of the triaxial accelerometer is mapped into an image with the single pixel column and multi-channel which is input into the U-Net network for training and recognition. Our proposal can complete the pixel-level gesture recognition function. The method does not need manual feature extraction and can effectively identify short-term behaviors in long-term activity sequences. We collected the Sanitation dataset and tested the proposed scheme with four open data sets. The experimental results show that compared with Support Vector Machine (SVM), k-Nearest Neighbor (kNN), Decision Tree(DT), Quadratic Discriminant Analysis (QDA), Convolutional Neural Network (CNN) and Fully Convolutional Networks (FCN) methods, our proposal has the highest accuracy and F1-socre in each dataset, and has stable performance and high robustness. At the same time, after the U-Net has finished training, our proposal can achieve fast enough recognition speed.
A plug-in graph neural network to boost temporal sensitivity in fMRI analysis
Jan 01, 2023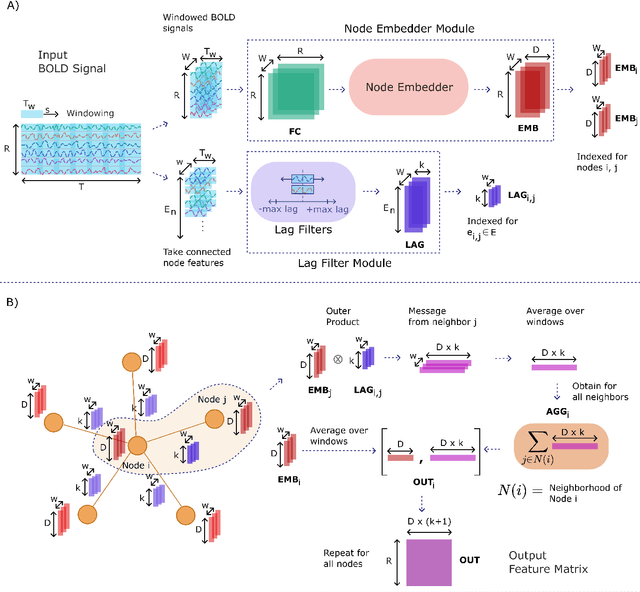
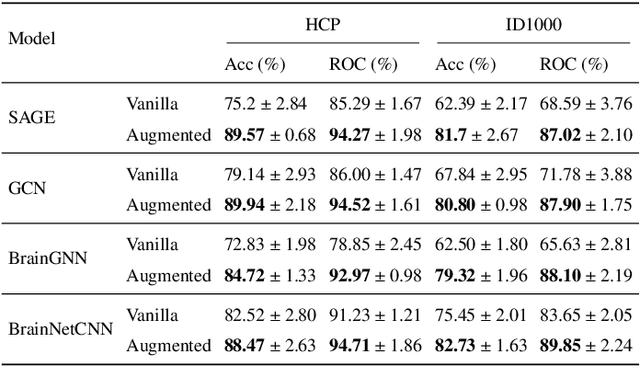
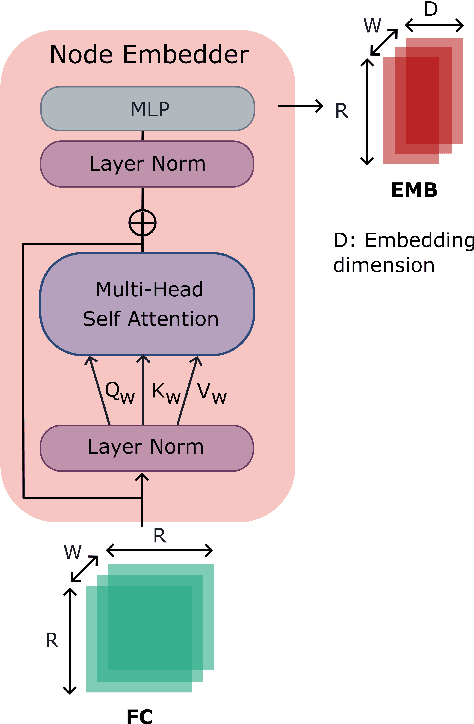
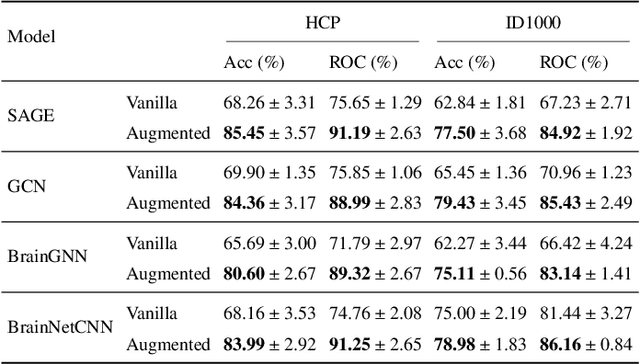
Learning-based methods have recently enabled performance leaps in analysis of high-dimensional functional MRI (fMRI) time series. Deep learning models that receive as input functional connectivity (FC) features among brain regions have been commonly adopted in the literature. However, many models focus on temporally static FC features across a scan, reducing sensitivity to dynamic features of brain activity. Here, we describe a plug-in graph neural network that can be flexibly integrated into a main learning-based fMRI model to boost its temporal sensitivity. Receiving brain regions as nodes and blood-oxygen-level-dependent (BOLD) signals as node inputs, the proposed GraphCorr method leverages a node embedder module based on a transformer encoder to capture temporally-windowed latent representations of BOLD signals. GraphCorr also leverages a lag filter module to account for delayed interactions across nodes by computing cross-correlation of windowed BOLD signals across a range of time lags. Information captured by the two modules is fused via a message passing algorithm executed on the graph, and enhanced node features are then computed at the output. These enhanced features are used to drive a subsequent learning-based model to analyze fMRI time series with elevated sensitivity. Comprehensive demonstrations on two public datasets indicate improved classification performance and interpretability for several state-of-the-art graphical and convolutional methods that employ GraphCorr-derived feature representations of fMRI time series as their input.
Multi-head Temporal Attention-Augmented Bilinear Network for Financial time series prediction
Jan 14, 2022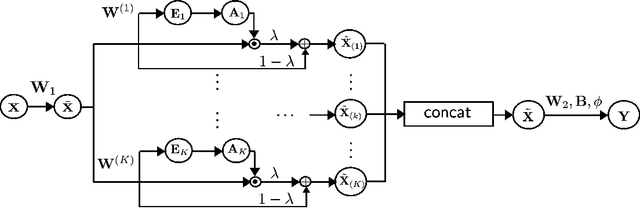
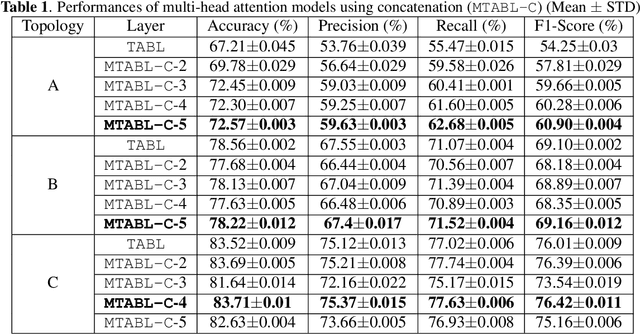
Financial time-series forecasting is one of the most challenging domains in the field of time-series analysis. This is mostly due to the highly non-stationary and noisy nature of financial time-series data. With progressive efforts of the community to design specialized neural networks incorporating prior domain knowledge, many financial analysis and forecasting problems have been successfully tackled. The temporal attention mechanism is a neural layer design that recently gained popularity due to its ability to focus on important temporal events. In this paper, we propose a neural layer based on the ideas of temporal attention and multi-head attention to extend the capability of the underlying neural network in focusing simultaneously on multiple temporal instances. The effectiveness of our approach is validated using large-scale limit-order book market data to forecast the direction of mid-price movements. Our experiments show that the use of multi-head temporal attention modules leads to enhanced prediction performances compared to baseline models.
A Comparative Study of Detecting Anomalies in Time Series Data Using LSTM and TCN Models
Dec 17, 2021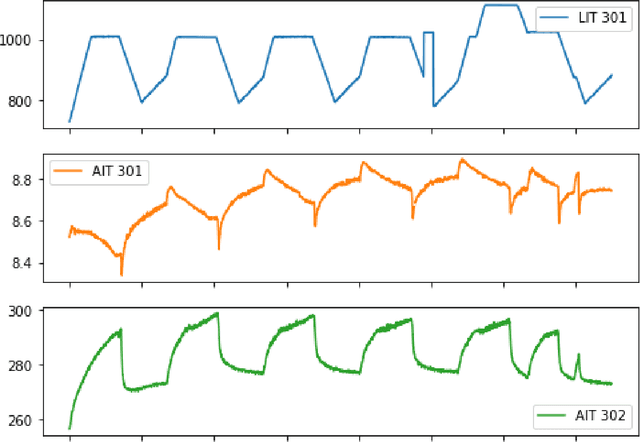
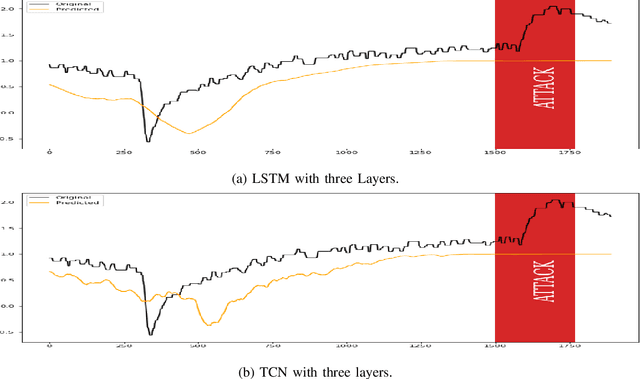
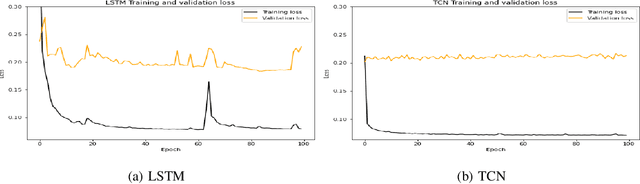
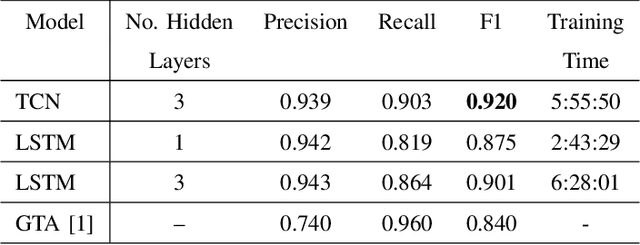
There exist several data-driven approaches that enable us model time series data including traditional regression-based modeling approaches (i.e., ARIMA). Recently, deep learning techniques have been introduced and explored in the context of time series analysis and prediction. A major research question to ask is the performance of these many variations of deep learning techniques in predicting time series data. This paper compares two prominent deep learning modeling techniques. The Recurrent Neural Network (RNN)-based Long Short-Term Memory (LSTM) and the convolutional Neural Network (CNN)-based Temporal Convolutional Networks (TCN) are compared and their performance and training time are reported. According to our experimental results, both modeling techniques perform comparably having TCN-based models outperform LSTM slightly. Moreover, the CNN-based TCN model builds a stable model faster than the RNN-based LSTM models.
Per-run Algorithm Selection with Warm-starting using Trajectory-based Features
Apr 20, 2022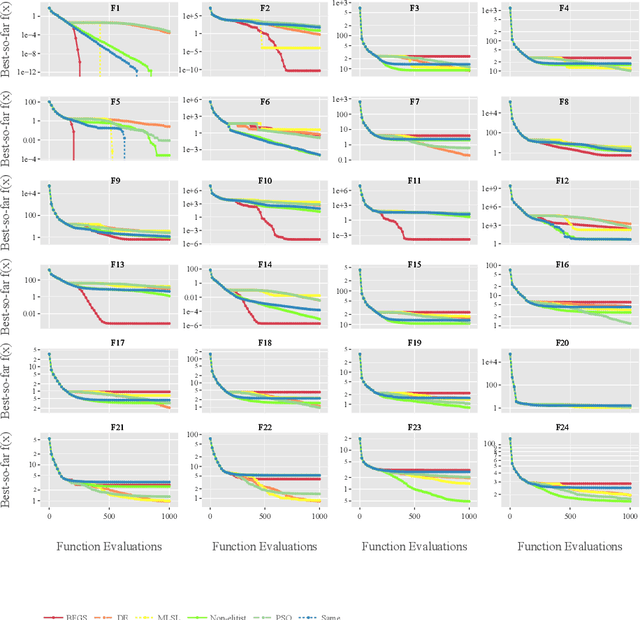
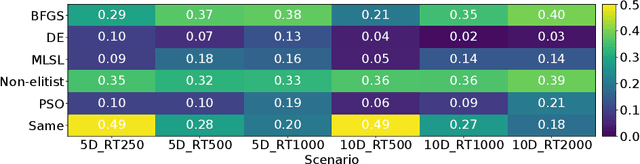
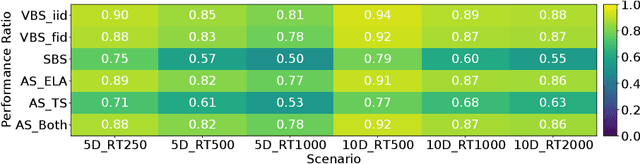
Per-instance algorithm selection seeks to recommend, for a given problem instance and a given performance criterion, one or several suitable algorithms that are expected to perform well for the particular setting. The selection is classically done offline, using openly available information about the problem instance or features that are extracted from the instance during a dedicated feature extraction step. This ignores valuable information that the algorithms accumulate during the optimization process. In this work, we propose an alternative, online algorithm selection scheme which we coin per-run algorithm selection. In our approach, we start the optimization with a default algorithm, and, after a certain number of iterations, extract instance features from the observed trajectory of this initial optimizer to determine whether to switch to another optimizer. We test this approach using the CMA-ES as the default solver, and a portfolio of six different optimizers as potential algorithms to switch to. In contrast to other recent work on online per-run algorithm selection, we warm-start the second optimizer using information accumulated during the first optimization phase. We show that our approach outperforms static per-instance algorithm selection. We also compare two different feature extraction principles, based on exploratory landscape analysis and time series analysis of the internal state variables of the CMA-ES, respectively. We show that a combination of both feature sets provides the most accurate recommendations for our test cases, taken from the BBOB function suite from the COCO platform and the YABBOB suite from the Nevergrad platform.
Using Entropy Measures for Monitoring the Evolution of Activity Patterns
Oct 05, 2022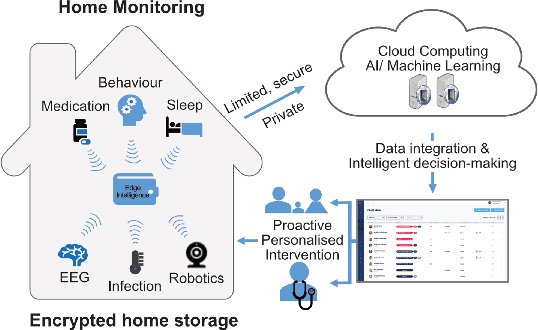
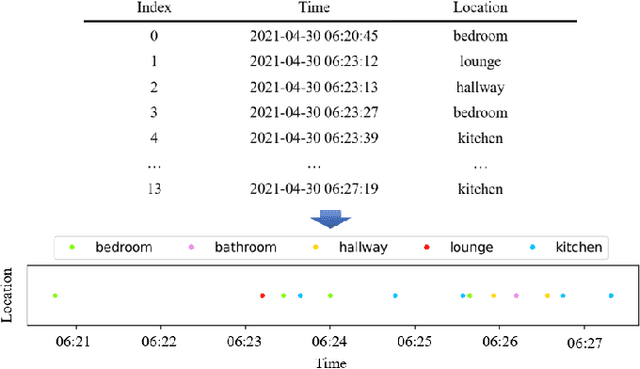
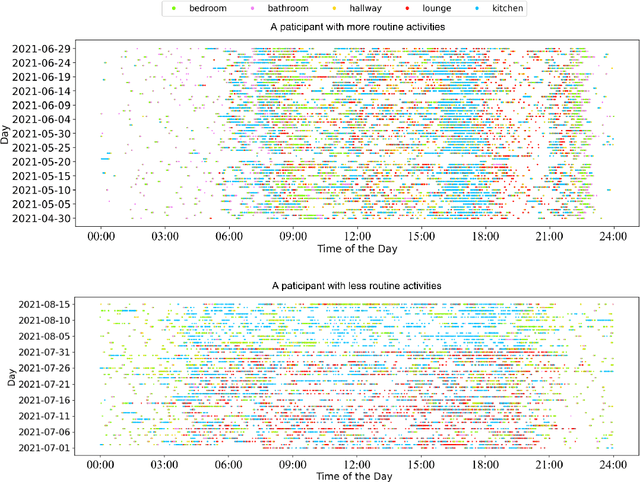
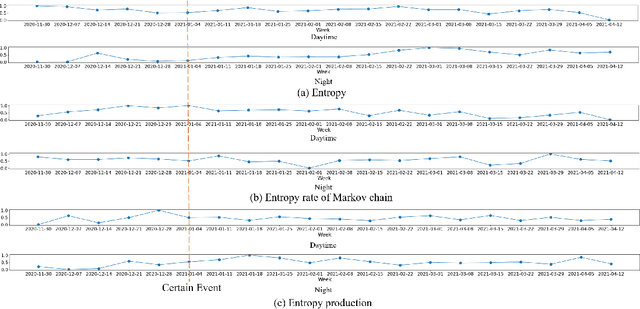
In this work, we apply information theory inspired methods to quantify changes in daily activity patterns. We use in-home movement monitoring data and show how they can help indicate the occurrence of healthcare-related events. Three different types of entropy measures namely Shannon's entropy, entropy rates for Markov chains, and entropy production rate have been utilised. The measures are evaluated on a large-scale in-home monitoring dataset that has been collected within our dementia care clinical study. The study uses Internet of Things (IoT) enabled solutions for continuous monitoring of in-home activity, sleep, and physiology to develop care and early intervention solutions to support people living with dementia (PLWD) in their own homes. Our main goal is to show the applicability of the entropy measures to time-series activity data analysis and to use the extracted measures as new engineered features that can be fed into inference and analysis models. The results of our experiments show that in most cases the combination of these measures can indicate the occurrence of healthcare-related events. We also find that different participants with the same events may have different measures based on one entropy measure. So using a combination of these measures in an inference model will be more effective than any of the single measures.
Comparative Analysis of Time Series Forecasting Approaches for Household Electricity Consumption Prediction
Jul 03, 2022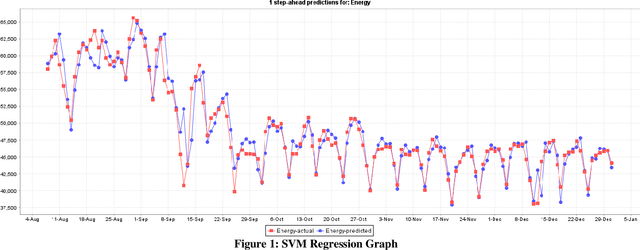
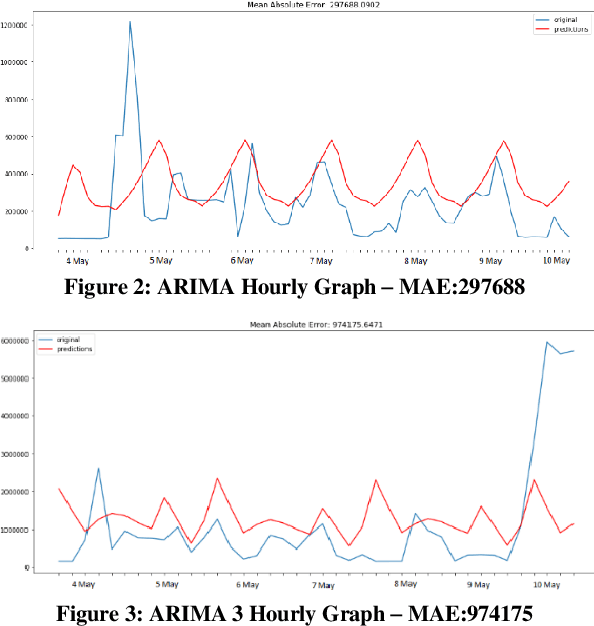
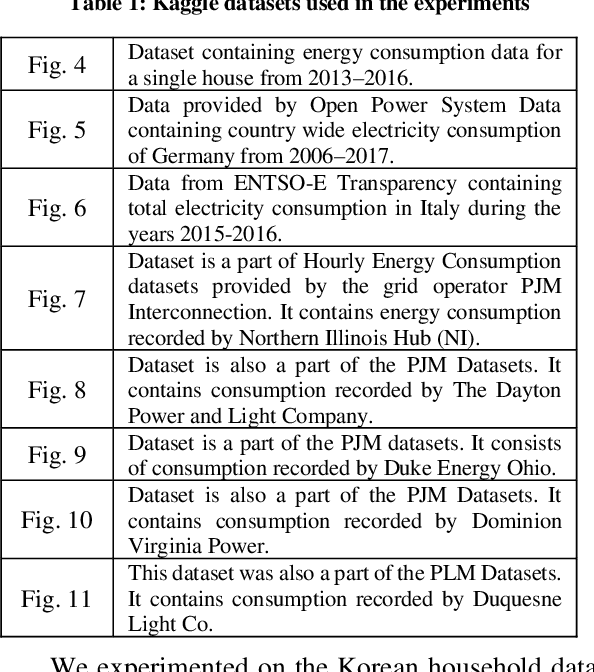
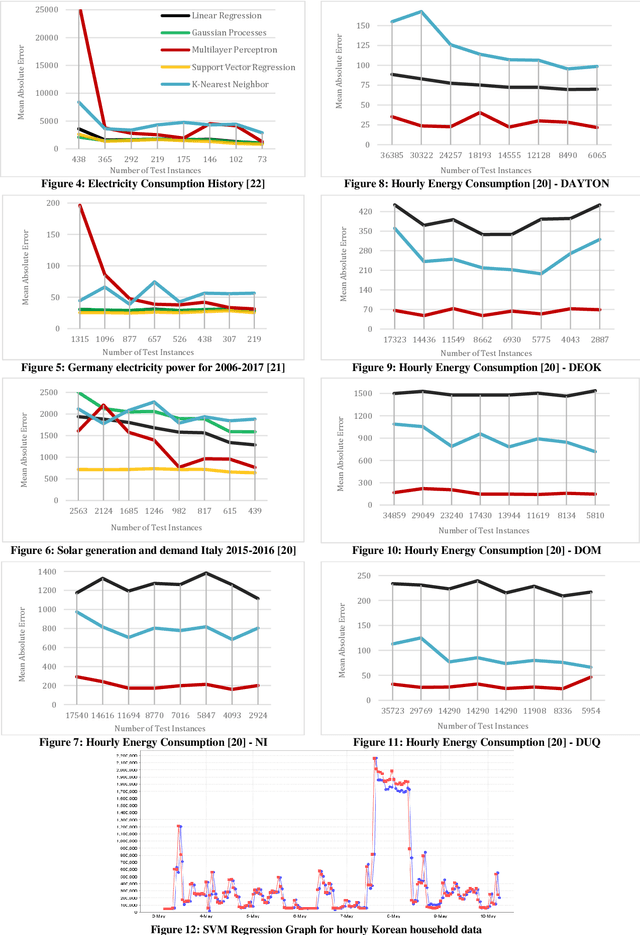
As a result of increasing population and globalization, the demand for energy has greatly risen. Therefore, accurate energy consumption forecasting has become an essential prerequisite for government planning, reducing power wastage and stable operation of the energy management system. In this work we present a comparative analysis of major machine learning models for time series forecasting of household energy consumption. Specifically, we use Weka, a data mining tool to first apply models on hourly and daily household energy consumption datasets available from Kaggle data science community. The models applied are: Multilayer Perceptron, K Nearest Neighbor regression, Support Vector Regression, Linear Regression, and Gaussian Processes. Secondly, we also implemented time series forecasting models, ARIMA and VAR, in python to forecast household energy consumption of selected South Korean households with and without weather data. Our results show that the best methods for the forecasting of energy consumption prediction are Support Vector Regression followed by Multilayer Perceptron and Gaussian Process Regression.
A Modified Dynamic Time Warping (MDTW) Approach and Innovative Average Non-Self Match Distance (ANSD) Method for Anomaly Detection in ECG Recordings
Nov 01, 2021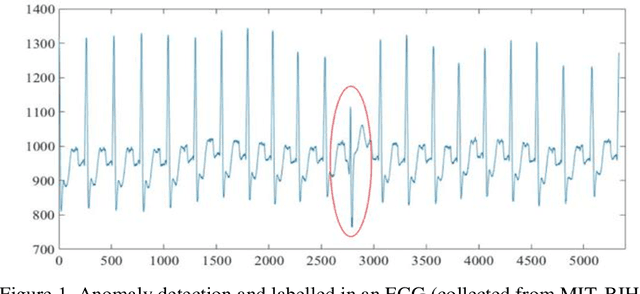
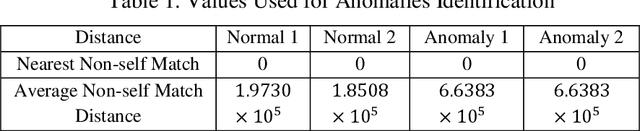
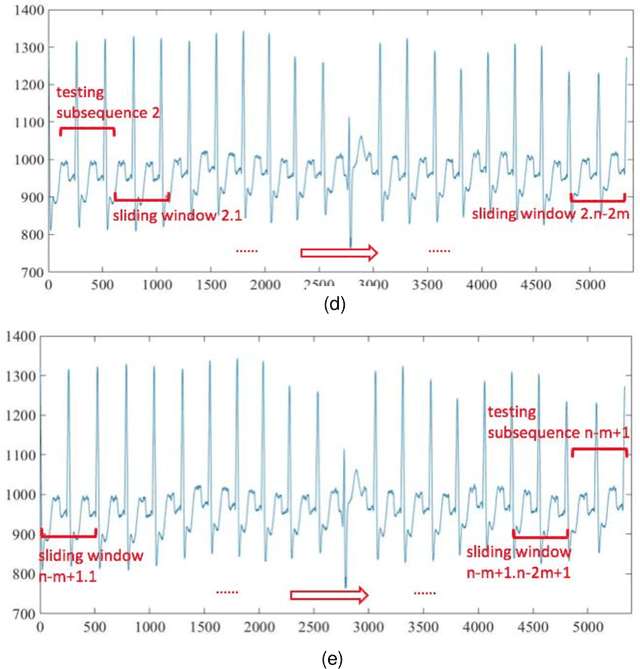
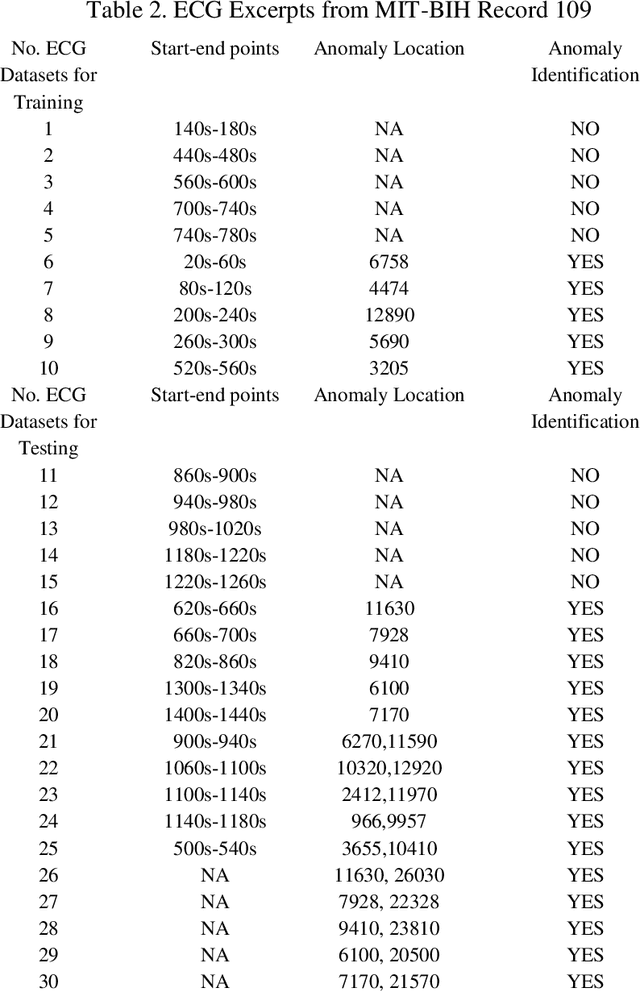
ECGs objectively reflects the working conditions of the hearts as these signals contain vast physiological and pathological information. In this work, in order to improve the efficiency and accuracy of "best so far" time series analysis-based ECG anomaly detection methods, a novel method, comprising a modified dynamic time warping (MDTW) and an innovative average non-self match distance (ANSD) measure, is proposed for ECG anomaly detection. To evaluate the performance of the proposed method, the proposed method is applied to real ECG data selected from the MIT-BIH heartbeat database. To provide a reference for comparison, two existing anomaly detection methods, namely, brute force discord discovery (BFDD) and adaptive window discord discovery (AWDD), are also applied to the same data. The experimental results show that our proposed method outperforms BFDD and AWD.
Time Series Analysis of Electricity Price and Demand to Find Cyber-attacks using Stationary Analysis
Aug 20, 2019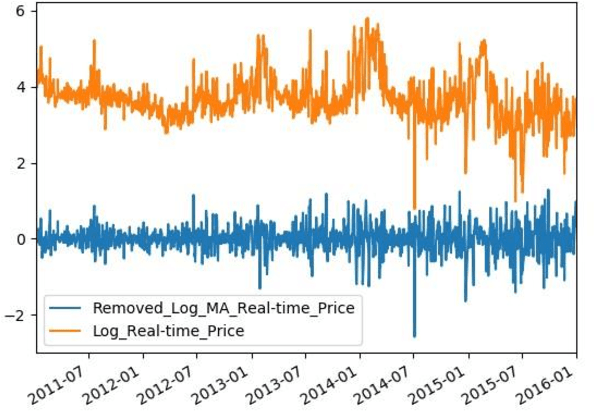
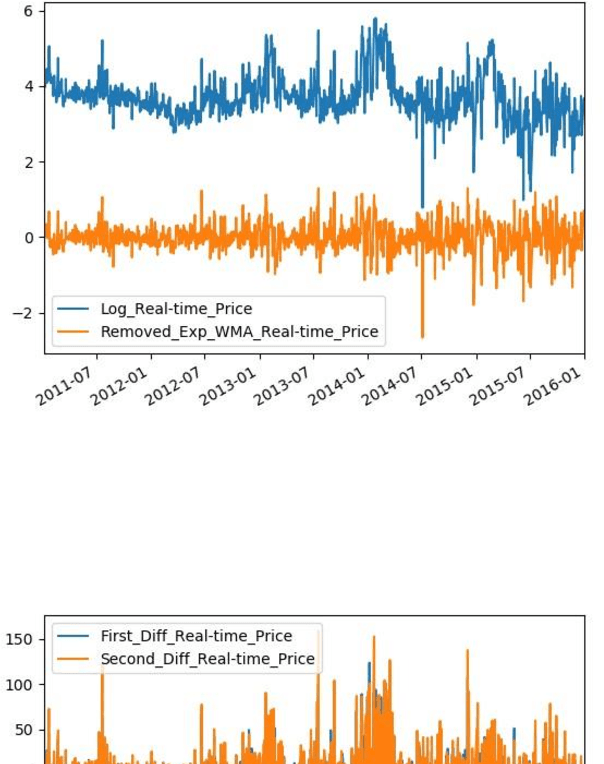
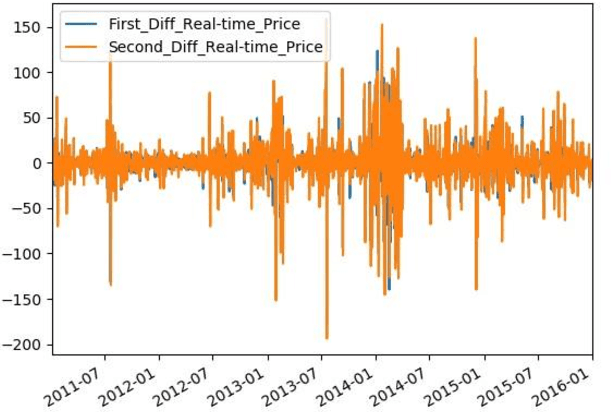
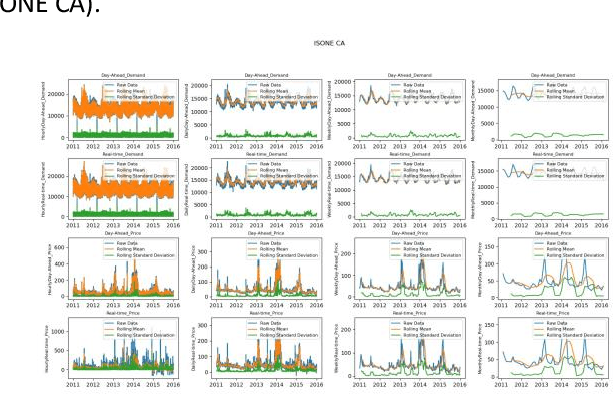
With developing of computation tools in the last years, data analysis methods to find insightful information are becoming more common among industries and researchers. This paper is the first part of the times series analysis of New England electricity price and demand to find anomaly in the data. In this paper time-series stationary criteria to prepare data for further times-series related analysis is investigated. Three main analysis are conducted in this paper, including moving average, moving standard deviation and augmented Dickey-Fuller test. The data used in this paper is New England big data from 9 different operational zones. For each zone, 4 different variables including day-ahead (DA) electricity demand, price and real-time (RT) electricity demand price are considered.
Denoising neural networks for magnetic resonance spectroscopy
Oct 31, 2022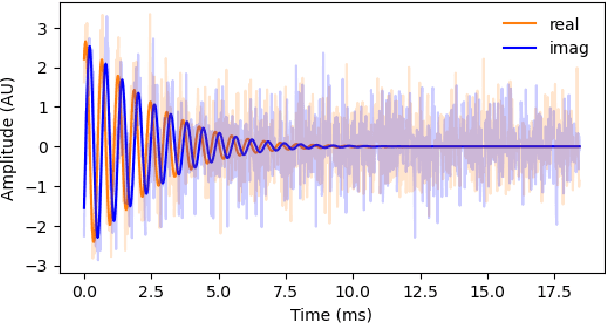
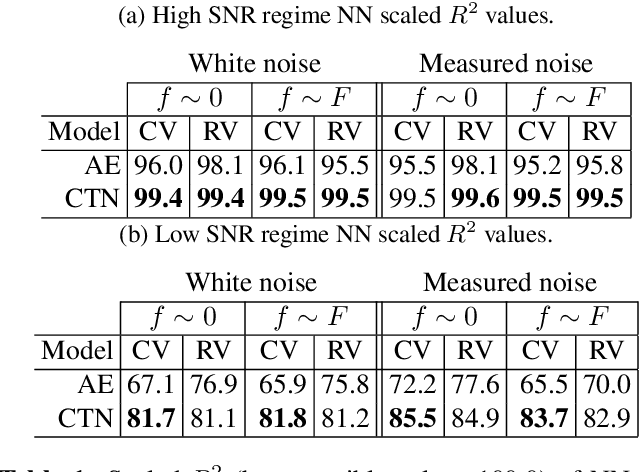
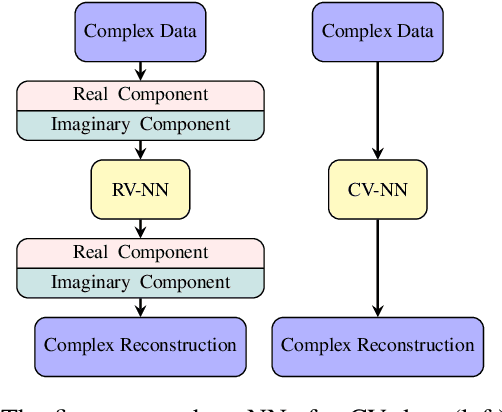
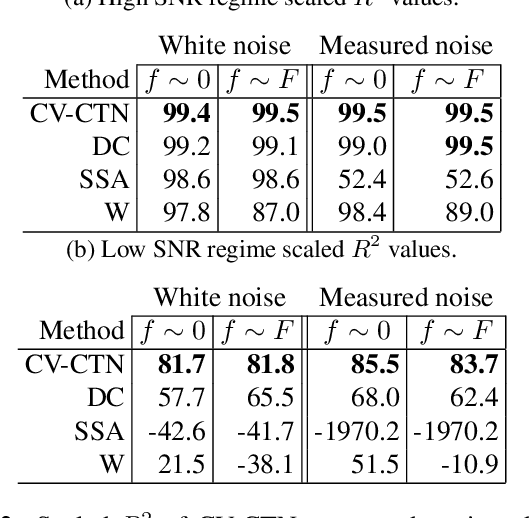
In many scientific applications, measured time series are corrupted by noise or distortions. Traditional denoising techniques often fail to recover the signal of interest, particularly when the signal-to-noise ratio is low or when certain assumptions on the signal and noise are violated. In this work, we demonstrate that deep learning-based denoising methods can outperform traditional techniques while exhibiting greater robustness to variation in noise and signal characteristics. Our motivating example is magnetic resonance spectroscopy, in which a primary goal is to detect the presence of short-duration, low-amplitude radio frequency signals that are often obscured by strong interference that can be difficult to separate from the signal using traditional methods. We explore various deep learning architecture choices to capture the inherently complex-valued nature of magnetic resonance signals. On both synthetic and experimental data, we show that our deep learning-based approaches can exceed performance of traditional techniques, providing a powerful new class of methods for analysis of scientific time series data.