 Add to Chrome
 Add to Firefox
 Add to Edge
"Time Series Analysis": models, code, and papers
A Functional approach for Two Way Dimension Reduction in Time Series
Jan 01, 2023
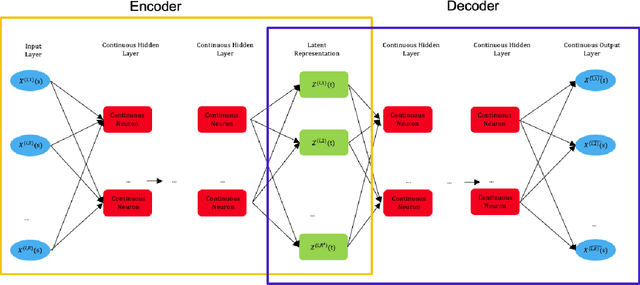
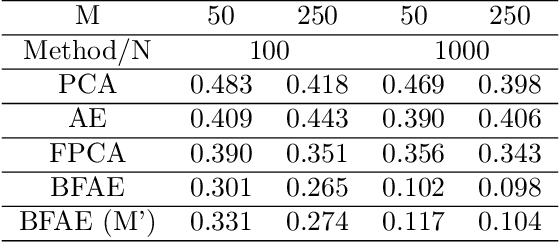
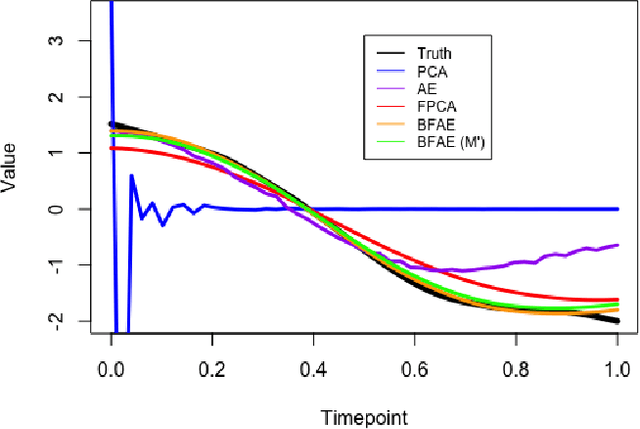
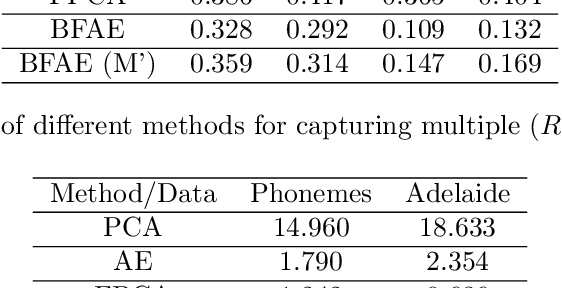
The rise in data has led to the need for dimension reduction techniques, especially in the area of non-scalar variables, including time series, natural language processing, and computer vision. In this paper, we specifically investigate dimension reduction for time series through functional data analysis. Current methods for dimension reduction in functional data are functional principal component analysis and functional autoencoders, which are limited to linear mappings or scalar representations for the time series, which is inefficient. In real data applications, the nature of the data is much more complex. We propose a non-linear function-on-function approach, which consists of a functional encoder and a functional decoder, that uses continuous hidden layers consisting of continuous neurons to learn the structure inherent in functional data, which addresses the aforementioned concerns in the existing approaches. Our approach gives a low dimension latent representation by reducing the number of functional features as well as the timepoints at which the functions are observed. The effectiveness of the proposed model is demonstrated through multiple simulations and real data examples.
* 10 pages, 4 figures, 4 tables
Edge-Varying Fourier Graph Networks for Multivariate Time Series Forecasting
Oct 09, 2022
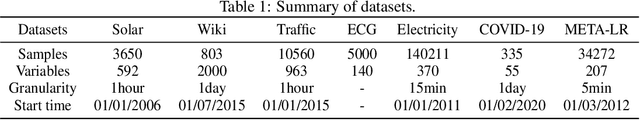
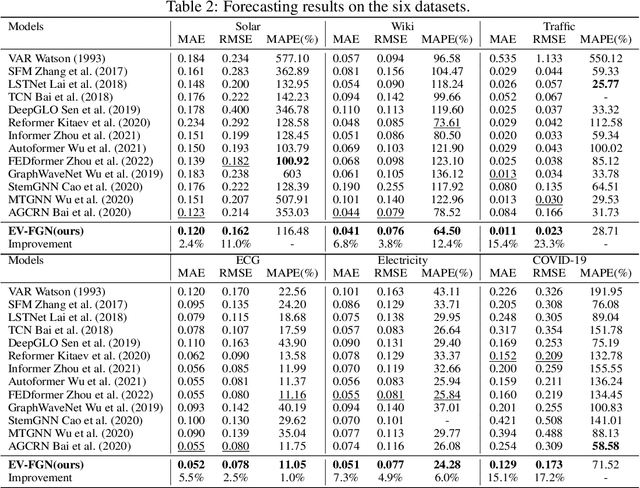
The key problem in multivariate time series (MTS) analysis and forecasting aims to disclose the underlying couplings between variables that drive the co-movements. Considerable recent successful MTS methods are built with graph neural networks (GNNs) due to their essential capacity for relational modeling. However, previous work often used a static graph structure of time-series variables for modeling MTS failing to capture their ever-changing correlations over time. To this end, a fully-connected supra-graph connecting any two variables at any two timestamps is adaptively learned to capture the high-resolution variable dependencies via an efficient graph convolutional network. Specifically, we construct the Edge-Varying Fourier Graph Networks (EV-FGN) equipped with Fourier Graph Shift Operator (FGSO) which efficiently performs graph convolution in the frequency domain. As a result, a high-efficiency scale-free parameter learning scheme is derived for MTS analysis and forecasting according to the convolution theorem. Extensive experiments show that EV-FGN outperforms state-of-the-art methods on seven real-world MTS datasets.
Multi-view Kernel PCA for Time series Forecasting
Jan 24, 2023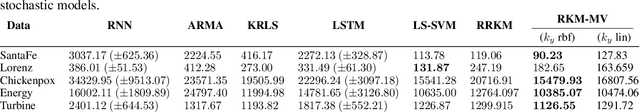
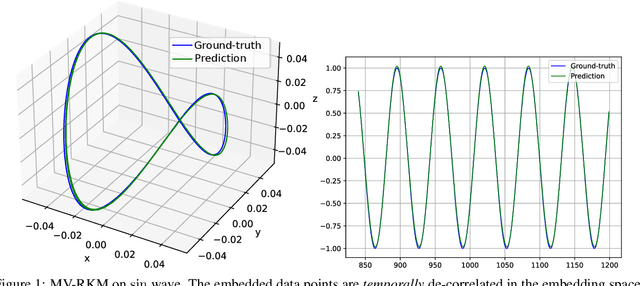
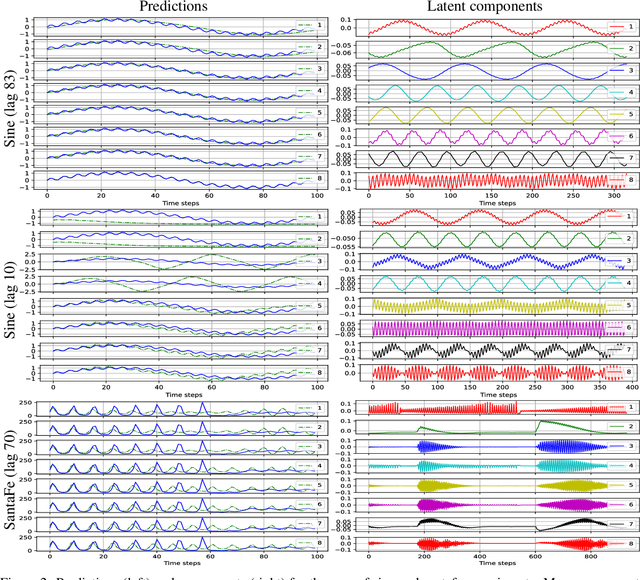
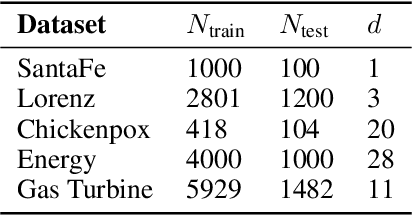
In this paper, we propose a kernel principal component analysis model for multi-variate time series forecasting, where the training and prediction schemes are derived from the multi-view formulation of Restricted Kernel Machines. The training problem is simply an eigenvalue decomposition of the summation of two kernel matrices corresponding to the views of the input and output data. When a linear kernel is used for the output view, it is shown that the forecasting equation takes the form of kernel ridge regression. When that kernel is non-linear, a pre-image problem has to be solved to forecast a point in the input space. We evaluate the model on several standard time series datasets, perform ablation studies, benchmark with closely related models and discuss its results.
TCN Mapping Optimization for Ultra-Low Power Time-Series Edge Inference
Mar 24, 2022
Temporal Convolutional Networks (TCNs) are emerging lightweight Deep Learning models for Time Series analysis. We introduce an automated exploration approach and a library of optimized kernels to map TCNs on Parallel Ultra-Low Power (PULP) microcontrollers. Our approach minimizes latency and energy by exploiting a layer tiling optimizer to jointly find the tiling dimensions and select among alternative implementations of the causal and dilated 1D-convolution operations at the core of TCNs. We benchmark our approach on a commercial PULP device, achieving up to 103X lower latency and 20.3X lower energy than the Cube-AI toolkit executed on the STM32L4 and from 2.9X to 26.6X lower energy compared to commercial closed-source and academic open-source approaches on the same hardware target.
COSTI: a New Classifier for Sequences of Temporal Intervals
Apr 28, 2022
Classification of sequences of temporal intervals is a part of time series analysis which concerns series of events. We propose a new method of transforming the problem to a task of multivariate series classification. We use one of the state-of-the-art algorithms from the latter domain on the new representation to obtain significantly better accuracy than the state-of-the-art methods from the former field. We discuss limitations of this workflow and address them by developing a novel method for classification termed COSTI (short for Classification of Sequences of Temporal Intervals) operating directly on sequences of temporal intervals. The proposed method remains at a high level of accuracy and obtains better performance while avoiding shortcomings connected to operating on transformed data. We propose a generalized version of the problem of classification of temporal intervals, where each event is supplemented with information about its intensity. We also provide two new data sets where this information is of substantial value.
Analysis and Comparison of Time Series of Power Consumption of Sistan and Tehran distribution networks
Jul 07, 2021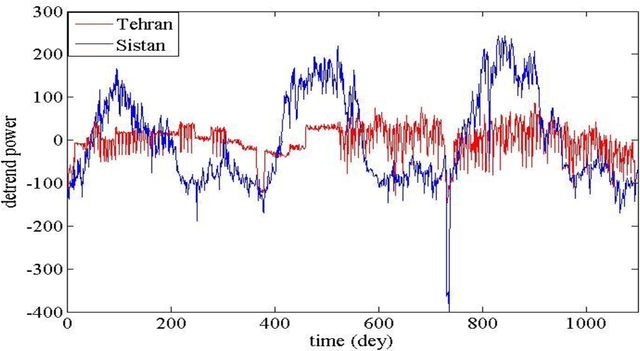
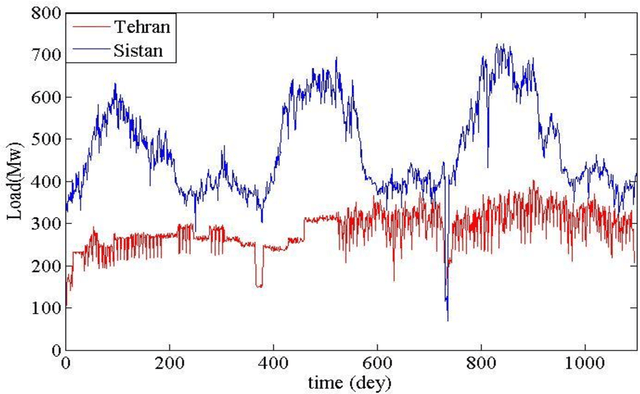
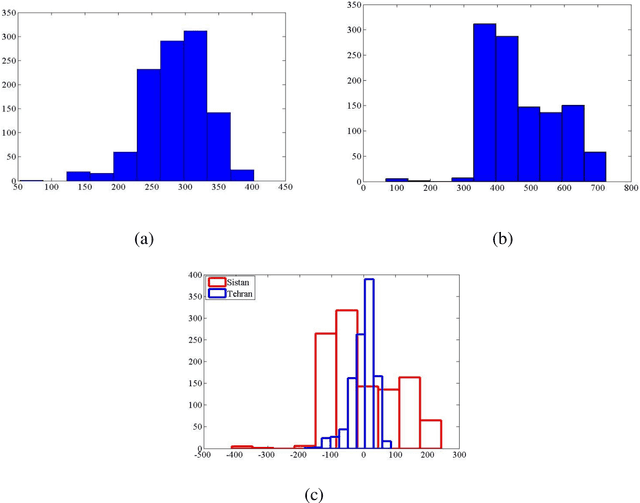
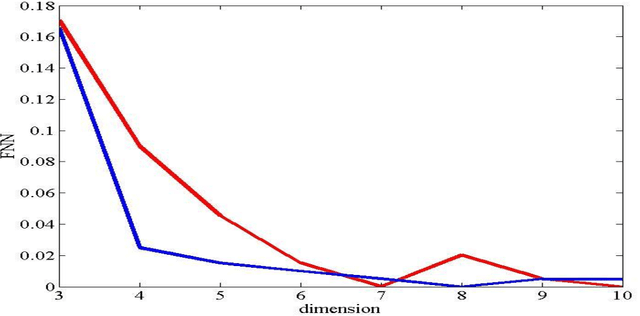
Data presented in the form of time series as its analysis and applications recently have become increasingly important in different areas and domains. Prediction and classification of time-series data play a vital role in multiple fields. In this paper, the time series analysis related to power consumption at 12 o'clock every day in the period of 2012 to 2014 has been compared for two distribution networks of Sistan and one of the four networks of Tehran. By analyzing the power consumption of these two networks, a comparison can be made between these two regions in terms of development and climate difference and the impact of social, industrial and environmental phenomena. The reason for choosing these two networks was to compare a deprived area with an area in the capital. CRP tool software and toolkits have been used to analyze and compare time series, and various tools have been used to compare two time series.
Deep Imputation of Missing Values in Time Series Health Data: A Review with Benchmarking
Feb 10, 2023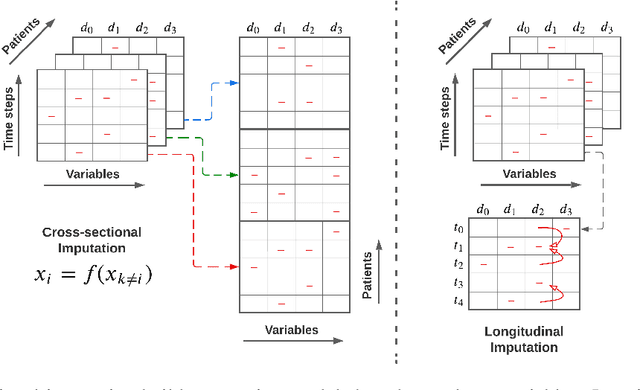
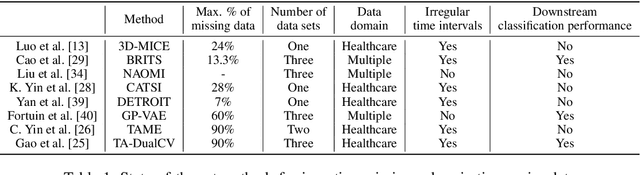
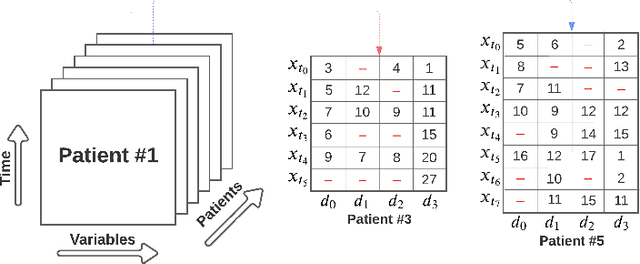
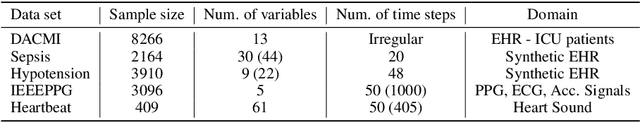
The imputation of missing values in multivariate time series data has been explored using a few recently proposed deep learning methods. The evaluation of these state-of-the-art methods is limited to one or two data sets, low missing rates, and completely random missing value types. These limited experiments do not comprehensively evaluate imputation methods on realistic data scenarios with varying missing rates and not-at-random missing types. This survey takes a data-centric approach to benchmark state-of-the-art deep imputation methods across five time series health data sets and six experimental conditions. Our extensive analysis reveals that no single imputation method outperforms the others on all five data sets. The imputation performance depends on data types, individual variable statistics, missing value rates, and types. In this context, state-of-the-art methods jointly perform cross-sectional (across variables) and longitudinal (across time) imputations of missing values in time series data. However, variables with high cross-correlation can be better imputed by cross-sectional imputation methods alone. In contrast, the ones with time series sensor signals may be better imputed by longitudinal imputation methods alone. The findings of this study emphasize the importance of considering data specifics when choosing a missing value imputation method for multivariate time series data.
A Comparative Study on Unsupervised Anomaly Detection for Time Series: Experiments and Analysis
Sep 10, 2022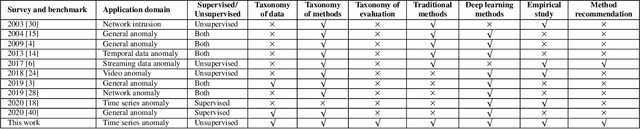
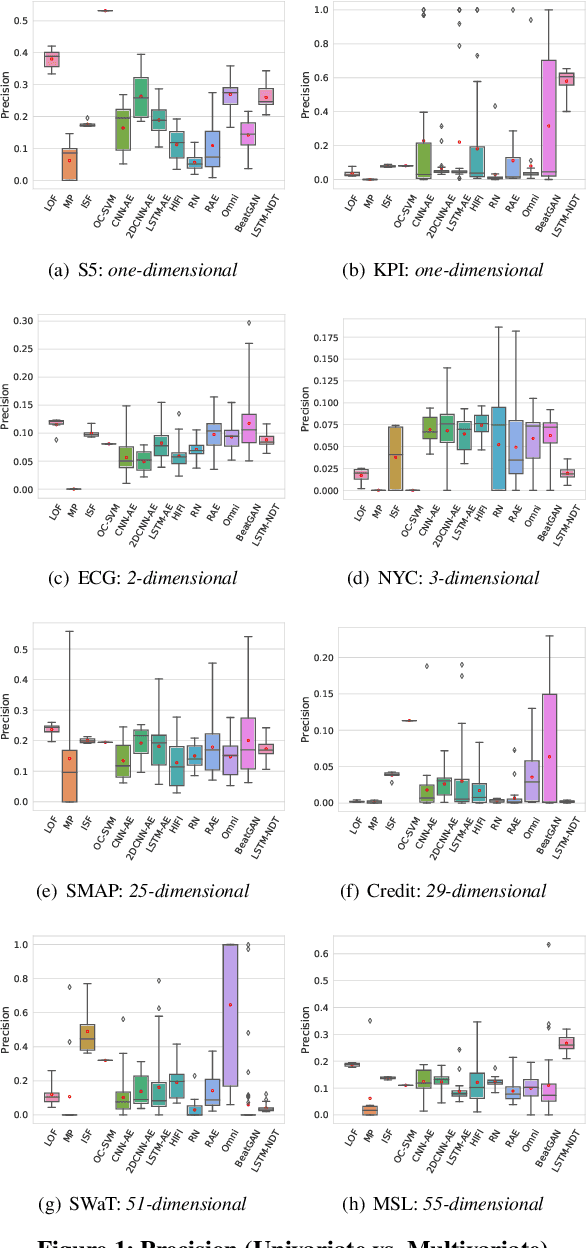
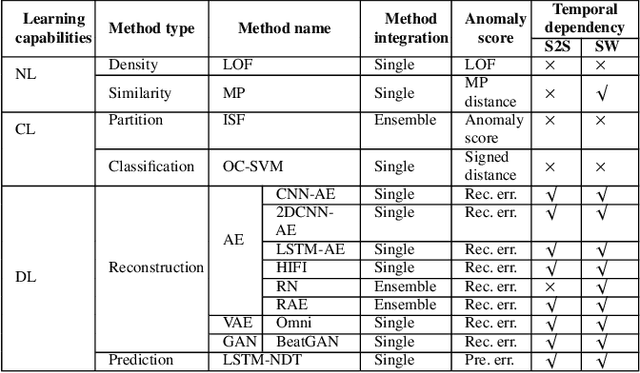
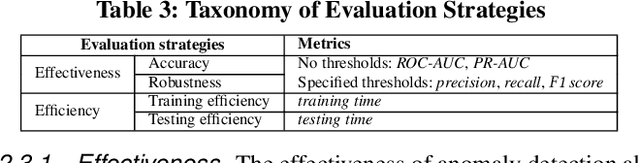
The continued digitization of societal processes translates into a proliferation of time series data that cover applications such as fraud detection, intrusion detection, and energy management, where anomaly detection is often essential to enable reliability and safety. Many recent studies target anomaly detection for time series data. Indeed, area of time series anomaly detection is characterized by diverse data, methods, and evaluation strategies, and comparisons in existing studies consider only part of this diversity, which makes it difficult to select the best method for a particular problem setting. To address this shortcoming, we introduce taxonomies for data, methods, and evaluation strategies, provide a comprehensive overview of unsupervised time series anomaly detection using the taxonomies, and systematically evaluate and compare state-of-the-art traditional as well as deep learning techniques. In the empirical study using nine publicly available datasets, we apply the most commonly-used performance evaluation metrics to typical methods under a fair implementation standard. Based on the structuring offered by the taxonomies, we report on empirical studies and provide guidelines, in the form of comparative tables, for choosing the methods most suitable for particular application settings. Finally, we propose research directions for this dynamic field.
Driver Maneuver Detection and Analysis using Time Series Segmentation and Classification
Nov 10, 2022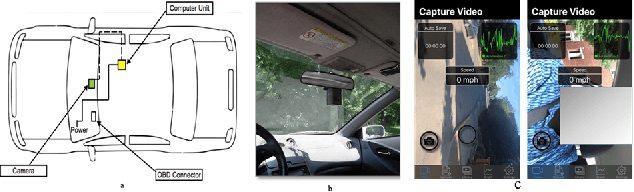
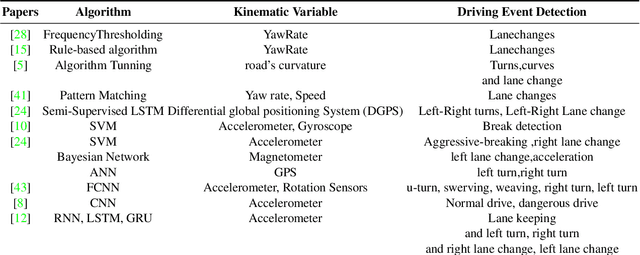
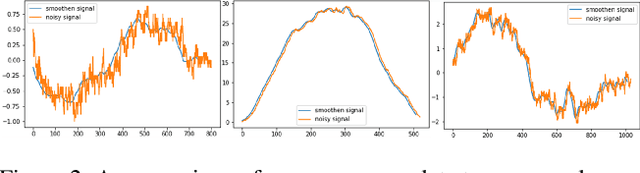
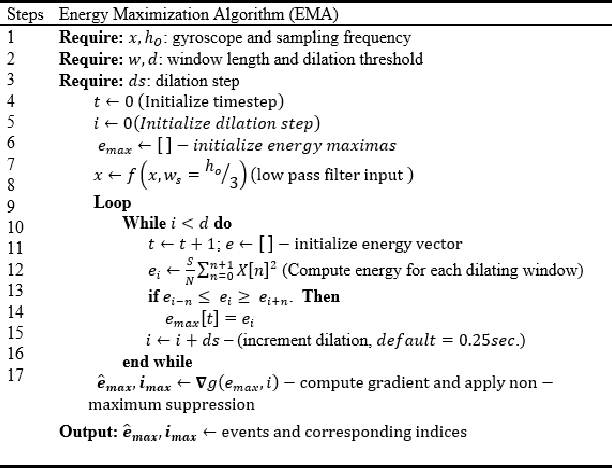
The current paper implements a methodology for automatically detecting vehicle maneuvers from vehicle telemetry data under naturalistic driving settings. Previous approaches have treated vehicle maneuver detection as a classification problem, although both time series segmentation and classification are required since input telemetry data is continuous. Our objective is to develop an end-to-end pipeline for frame-by-frame annotation of naturalistic driving studies videos into various driving events including stop and lane keeping events, lane changes, left-right turning movements, and horizontal curve maneuvers. To address the time series segmentation problem, the study developed an Energy Maximization Algorithm (EMA) capable of extracting driving events of varying durations and frequencies from continuous signal data. To reduce overfitting and false alarm rates, heuristic algorithms were used to classify events with highly variable patterns such as stops and lane-keeping. To classify segmented driving events, four machine learning models were implemented, and their accuracy and transferability were assessed over multiple data sources. The duration of events extracted by EMA were comparable to actual events, with accuracies ranging from 59.30% (left lane change) to 85.60% (lane-keeping). Additionally, the overall accuracy of the 1D-convolutional neural network model was 98.99%, followed by the Long-short-term-memory model at 97.75%, then random forest model at 97.71%, and the support vector machine model at 97.65%. These model accuracies where consistent across different data sources. The study concludes that implementing a segmentation-classification pipeline significantly improves both the accuracy for driver maneuver detection and transferability of shallow and deep ML models across diverse datasets.
Sequential Causal Effect Variational Autoencoder: Time Series Causal Link Estimation under Hidden Confounding
Sep 23, 2022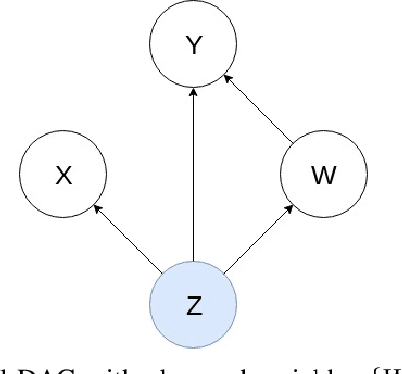
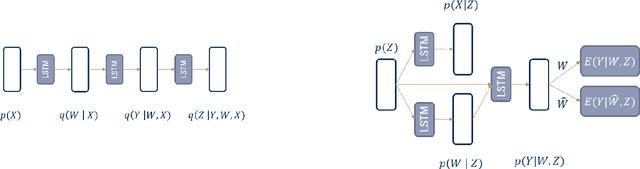
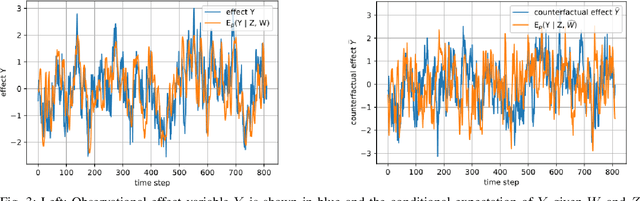
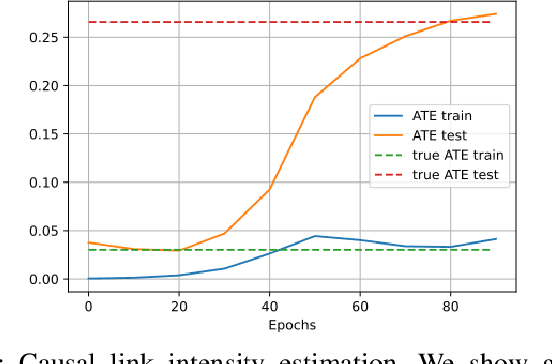
Estimating causal effects from observational data in the presence of latent variables sometimes leads to spurious relationships which can be misconceived as causal. This is an important issue in many fields such as finance and climate science. We propose Sequential Causal Effect Variational Autoencoder (SCEVAE), a novel method for time series causality analysis under hidden confounding. It is based on the CEVAE framework and recurrent neural networks. The causal link's intensity of the confounded variables is calculated by using direct causal criteria based on Pearl's do-calculus. We show the efficacy of SCEVAE by applying it to synthetic datasets with both linear and nonlinear causal links. Furthermore, we apply our method to real aerosol-cloud-climate observation data. We compare our approach to a time series deconfounding method with and without substitute confounders on the synthetic data. We demonstrate that our method performs better by comparing both methods to the ground truth. In the case of real data, we use the expert knowledge of causal links and show how the use of correct proxy variables aids data reconstruction.