 Add to Chrome
 Add to Firefox
 Add to Edge
"Time Series Analysis": models, code, and papers
Online learning of the transfer matrix of dynamic scattering media: wavefront shaping meets multidimensional time series
Oct 08, 2022
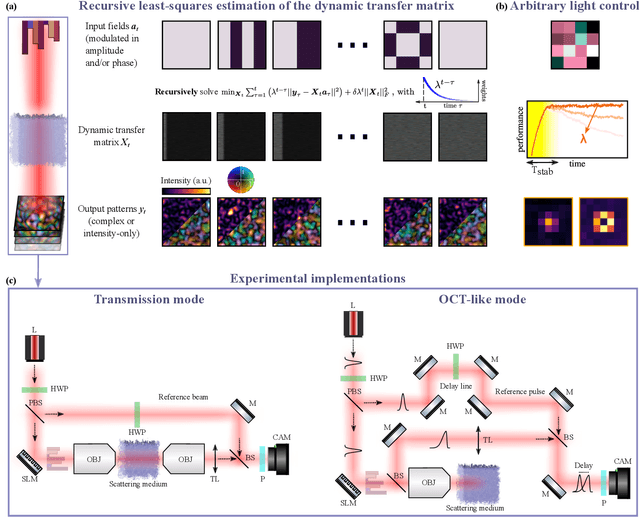
Thanks to the latest advancements in wavefront shaping, optical methods have proven crucial to achieve imaging and control light in multiply scattering media, like biological tissues. However, the stability times of living biological specimens often prevent such methods from gaining insights into relevant functioning mechanisms in cellular and organ systems. Here we present a recursive and online optimization routine, borrowed from time series analysis, to optimally track the transfer matrix of dynamic scattering media over arbitrarily long timescales. While preserving the advantages of both optimization-based routines and transfer-matrix measurements, it operates in a memory-efficient manner. Because it can be readily implemented in existing wavefront shaping setups, featuring amplitude and/or phase modulation and phase-resolved or intensity-only acquisition, it paves the way for efficient optical investigations of living biological specimens.
Regions of Reliability in the Evaluation of Multivariate Probabilistic Forecasts
Apr 19, 2023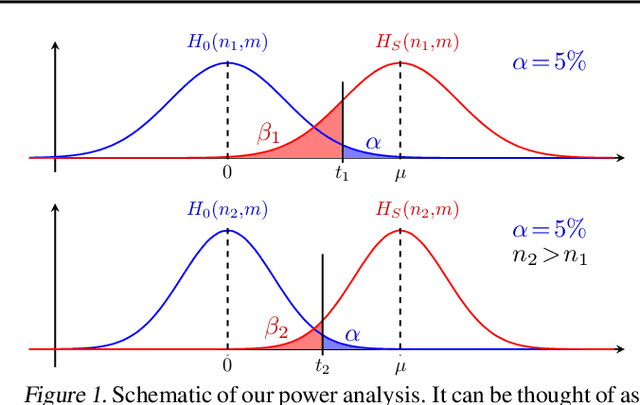
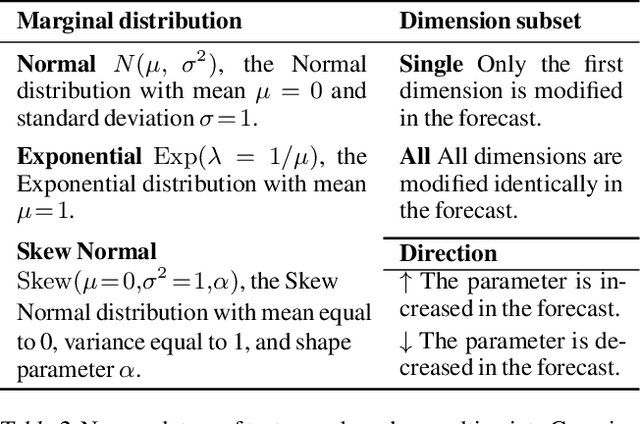
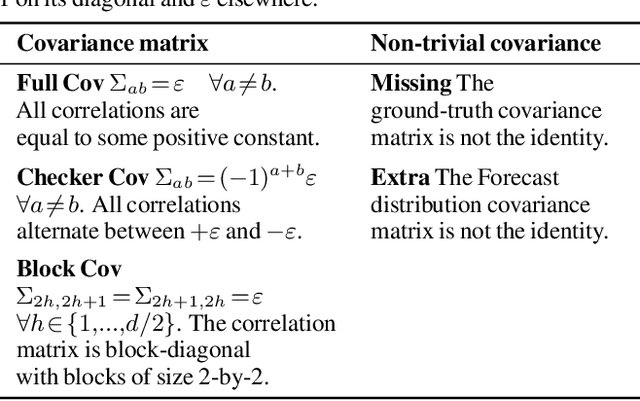
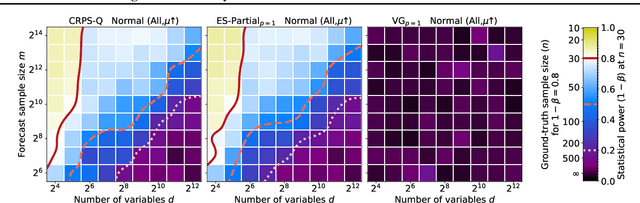
Multivariate probabilistic time series forecasts are commonly evaluated via proper scoring rules, i.e., functions that are minimal in expectation for the ground-truth distribution. However, this property is not sufficient to guarantee good discrimination in the non-asymptotic regime. In this paper, we provide the first systematic finite-sample study of proper scoring rules for time-series forecasting evaluation. Through a power analysis, we identify the "region of reliability" of a scoring rule, i.e., the set of practical conditions where it can be relied on to identify forecasting errors. We carry out our analysis on a comprehensive synthetic benchmark, specifically designed to test several key discrepancies between ground-truth and forecast distributions, and we gauge the generalizability of our findings to real-world tasks with an application to an electricity production problem. Our results reveal critical shortcomings in the evaluation of multivariate probabilistic forecasts as commonly performed in the literature.
Artificial neural networks and time series of counts: A class of nonlinear INGARCH models
Apr 03, 2023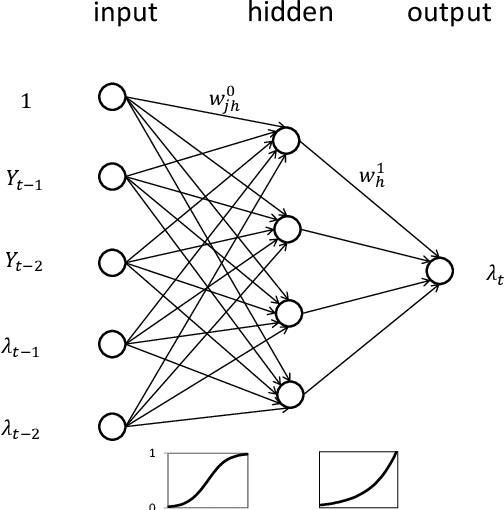
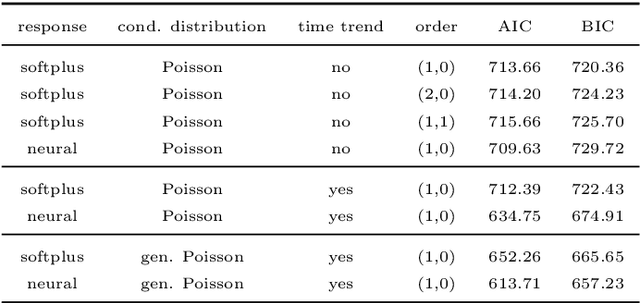
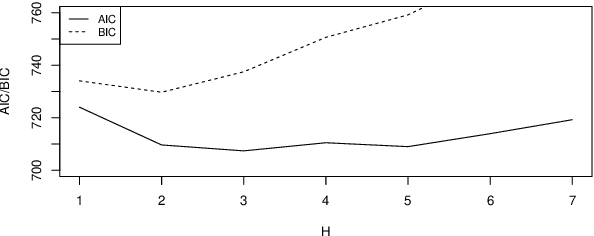
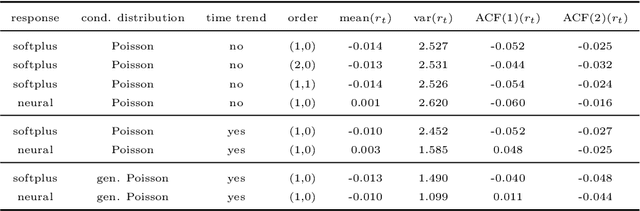
Time series of counts are frequently analyzed using generalized integer-valued autoregressive models with conditional heteroskedasticity (INGARCH). These models employ response functions to map a vector of past observations and past conditional expectations to the conditional expectation of the present observation. In this paper, it is shown how INGARCH models can be combined with artificial neural network (ANN) response functions to obtain a class of nonlinear INGARCH models. The ANN framework allows for the interpretation of many existing INGARCH models as a degenerate version of a corresponding neural model. Details on maximum likelihood estimation, marginal effects and confidence intervals are given. The empirical analysis of time series of bounded and unbounded counts reveals that the neural INGARCH models are able to outperform reasonable degenerate competitor models in terms of the information loss.
Neural Network Entropy (NNetEn): EEG Signals and Chaotic Time Series Separation by Entropy Features, Python Package for NNetEn Calculation
Mar 31, 2023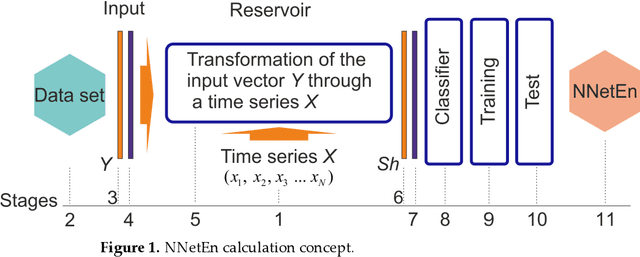
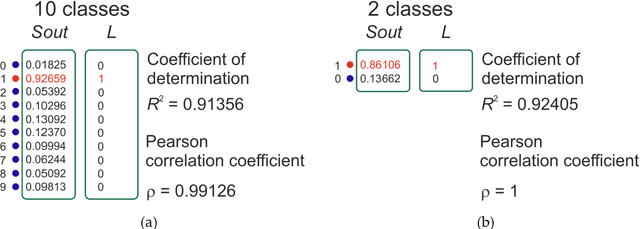
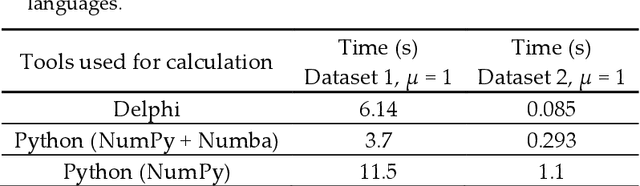
Entropy measures are effective features for time series classification problems. Traditional entropy measures, such as Shannon entropy, use probability distribution function. However, for the effective separation of time series, new entropy estimation methods are required to characterize the chaotic dynamic of the system. Our concept of Neural Network Entropy (NNetEn) is based on the classification of special datasets (MNIST-10 and SARS-CoV-2-RBV1) in relation to the entropy of the time series recorded in the reservoir of the LogNNet neural network. NNetEn estimates the chaotic dynamics of time series in an original way. Based on the NNetEn algorithm, we propose two new classification metrics: R2 Efficiency and Pearson Efficiency. The efficiency of NNetEn is verified on separation of two chaotic time series of sine mapping using dispersion analysis (ANOVA). For two close dynamic time series (r = 1.1918 and r = 1.2243), the F-ratio has reached the value of 124 and reflects high efficiency of the introduced method in classification problems. The EEG signal classification for healthy persons and patients with Alzheimer disease illustrates the practical application of the NNetEn features. Our computations demonstrate the synergistic effect of increasing classification accuracy when applying traditional entropy measures and the NNetEn concept conjointly. An implementation of the algorithms in Python is presented.
Time Series Analysis and Forecasting of COVID-19 Cases Using LSTM and ARIMA Models
Jun 05, 2020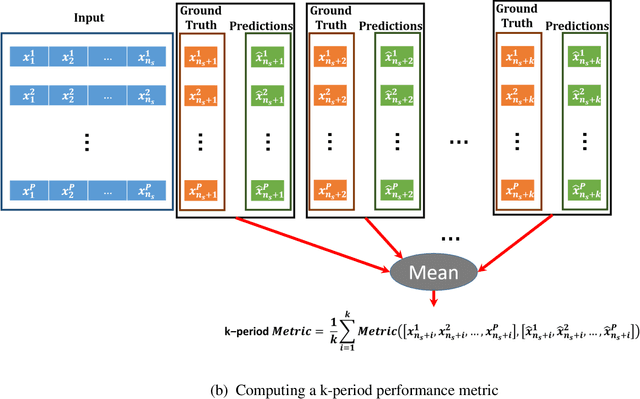
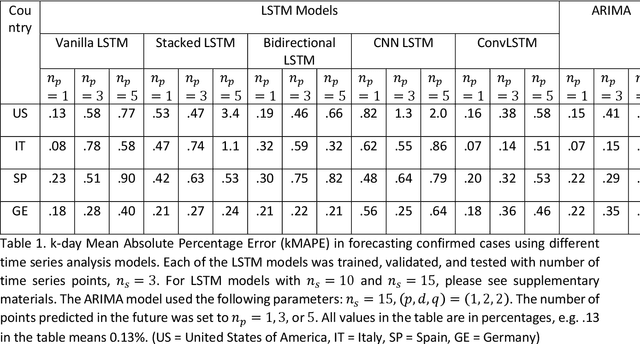
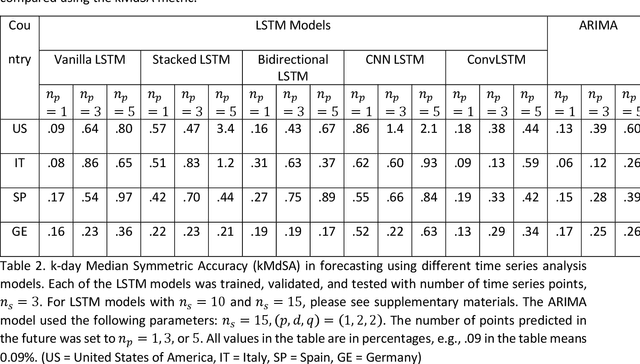
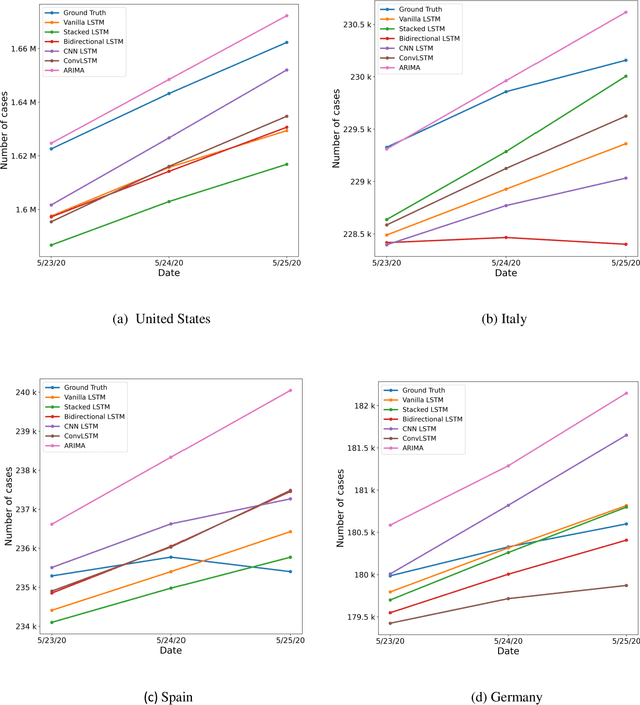
Coronavirus disease 2019 (COVID-19) is a global public health crisis that has been declared a pandemic by World Health Organization. Forecasting country-wise COVID-19 cases is necessary to help policymakers and healthcare providers prepare for the future. This study explores the performance of several Long Short-Term Memory (LSTM) models and Auto-Regressive Integrated Moving Average (ARIMA) model in forecasting the number of confirmed COVID-19 cases. Time series of daily cumulative COVID-19 cases were used for generating 1-day, 3-day, and 5-day forecasts using several LSTM models and ARIMA. Two novel k-period performance metrics - k-day Mean Absolute Percentage Error (kMAPE) and k-day Median Symmetric Accuracy (kMdSA) - were developed for evaluating the performance of the models in forecasting time series values for multiple days. Errors in prediction using kMAPE and kMdSA for LSTM models were both as low as 0.05%, while those for ARIMA were 0.07% and 0.06% respectively. LSTM models slightly underestimated while ARIMA slightly overestimated the numbers in the forecasts. The performance of LSTM models is comparable to ARIMA in forecasting COVID-19 cases. While ARIMA requires longer sequences, LSTMs can perform reasonably well with sequence sizes as small as 3. However, LSTMs require a large number of training samples. Further, the development of k-period performance metrics proposed is likely to be useful for performance evaluation of time series models in predicting multiple periods. Based on the k-period performance metrics proposed, both LSTMs and ARIMA are useful for time series analysis and forecasting for COVID-19.
Convolution-enhanced Evolving Attention Networks
Dec 16, 2022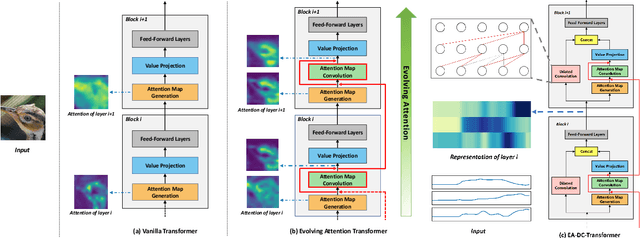
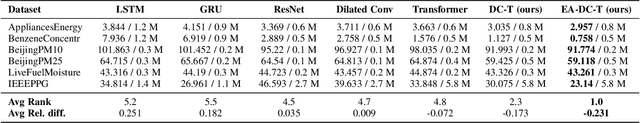
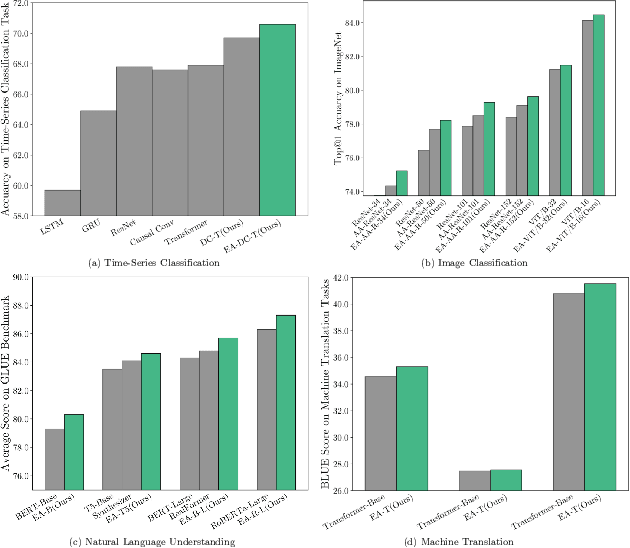
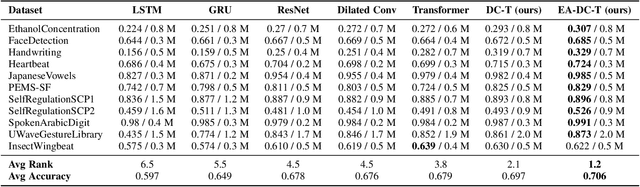
Attention-based neural networks, such as Transformers, have become ubiquitous in numerous applications, including computer vision, natural language processing, and time-series analysis. In all kinds of attention networks, the attention maps are crucial as they encode semantic dependencies between input tokens. However, most existing attention networks perform modeling or reasoning based on representations, wherein the attention maps of different layers are learned separately without explicit interactions. In this paper, we propose a novel and generic evolving attention mechanism, which directly models the evolution of inter-token relationships through a chain of residual convolutional modules. The major motivations are twofold. On the one hand, the attention maps in different layers share transferable knowledge, thus adding a residual connection can facilitate the information flow of inter-token relationships across layers. On the other hand, there is naturally an evolutionary trend among attention maps at different abstraction levels, so it is beneficial to exploit a dedicated convolution-based module to capture this process. Equipped with the proposed mechanism, the convolution-enhanced evolving attention networks achieve superior performance in various applications, including time-series representation, natural language understanding, machine translation, and image classification. Especially on time-series representation tasks, Evolving Attention-enhanced Dilated Convolutional (EA-DC-) Transformer outperforms state-of-the-art models significantly, achieving an average of 17% improvement compared to the best SOTA. To the best of our knowledge, this is the first work that explicitly models the layer-wise evolution of attention maps. Our implementation is available at https://github.com/pkuyym/EvolvingAttention
AtOMICS: A neural network-based Automated Optomechanical Intelligent Coupling System for testing and characterization of silicon photonics chiplets
Oct 30, 2022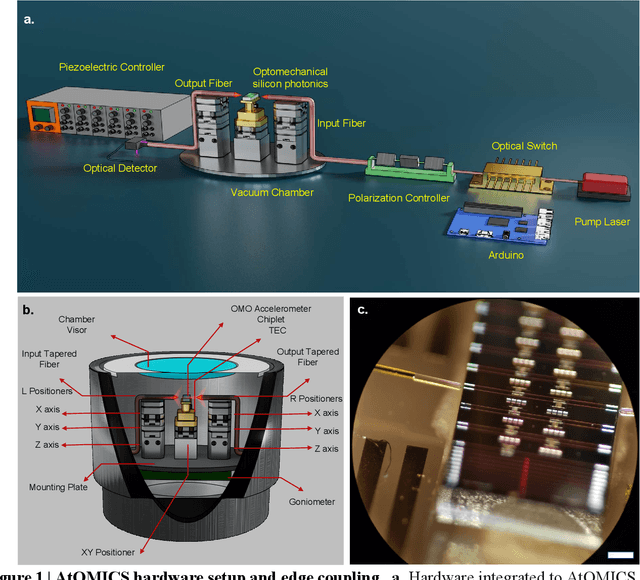
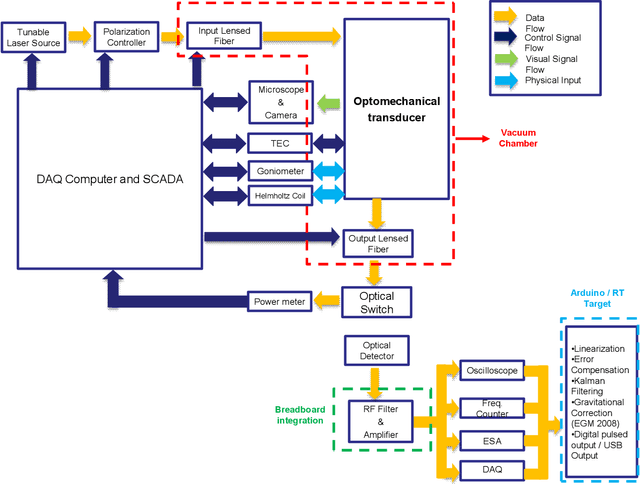
Recent advances in silicon photonics promise to revolutionize modern technology by improving performance of everyday devices in multiple fields. However, as the industry moves into a mass fabrication phase, the problem of effective testing of integrated silicon photonics devices remains to be solved. A cost-efficient manner that reduces schedule risk needs to involve automated testing of multiple devices that share common characteristics such as input-output coupling mechanisms, but at the same time needs to be generalizable to multiple types of devices and scenarios. In this paper we present a neural network-based automated system designed for in-plane fiber-chip-fiber testing, characterization, and active alignment of silicon photonic devices that use process-design-kit library edge couplers. The presented approach combines state-of-the-art computer vision techniques with time-series analysis, in order to control a testing setup that can process multiple devices and can be easily tuned to incorporate additional hardware. The system can operate at vacuum or atmospheric pressures and maintains stability for fairly long time periods in excess of a month.
A metric to compare the anatomy variation between image time series
Feb 23, 2023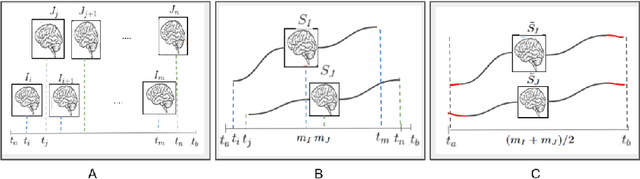
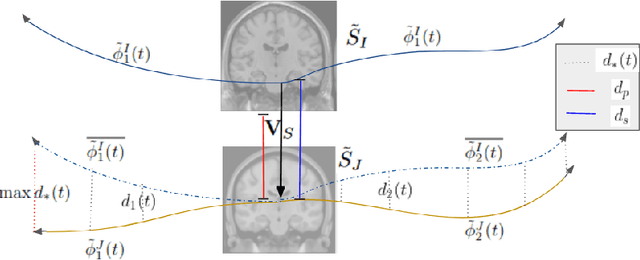
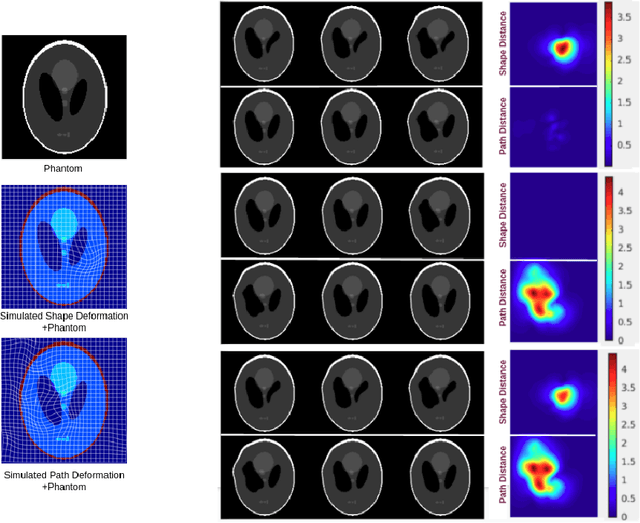
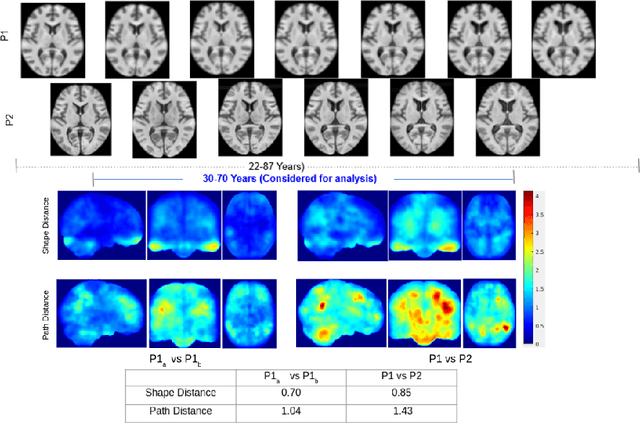
Biological processes like growth, aging, and disease progression are generally studied with follow-up scans taken at different time points, i.e., with image time series (TS) based analysis. Comparison between TS representing a biological process of two individuals/populations is of interest. A metric to quantify the difference between TS is desirable for such a comparison. The two TS represent the evolution of two different subject/population average anatomies through two paths. A method to untangle and quantify the path and inter-subject anatomy(shape) difference between the TS is presented in this paper. The proposed metric is a generalized version of Fr\'echet distance designed to compare curves. The proposed method is evaluated with simulated and adult and fetal neuro templates. Results show that the metric is able to separate and quantify the path and shape differences between TS.
A complex network approach to time series analysis with application in diagnosis of neuromuscular disorders
Aug 16, 2021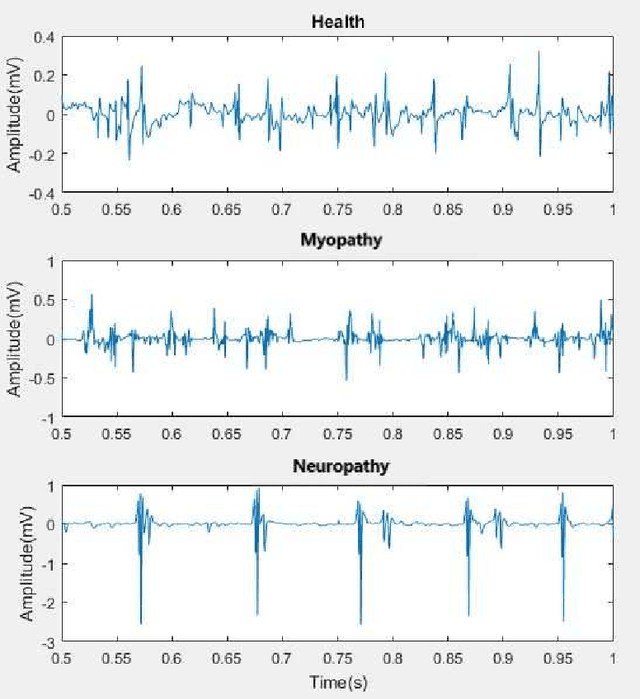
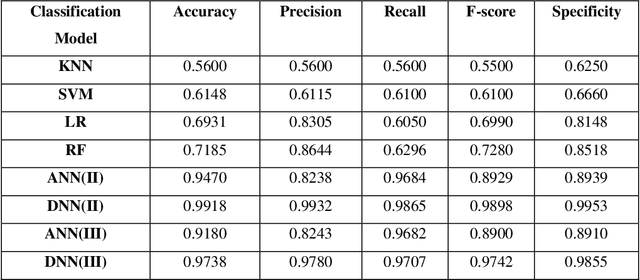
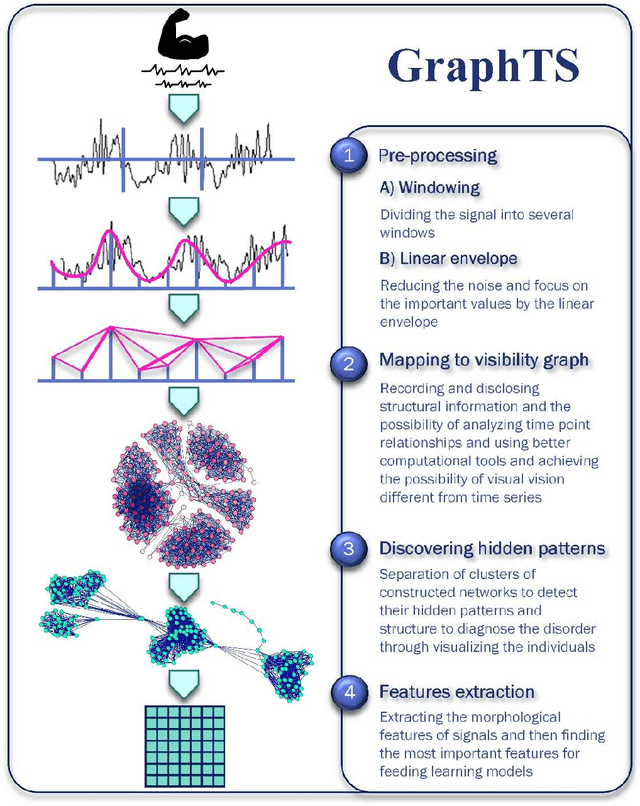
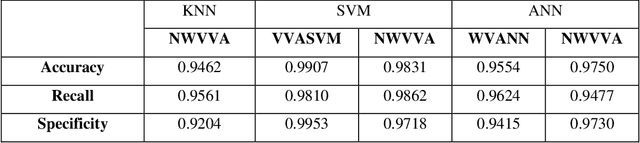
Electromyography (EMG) refers to a biomedical signal indicating neuromuscular activity and muscle morphology. Experts accurately diagnose neuromuscular disorders using this time series. Modern data analysis techniques have recently led to introducing novel approaches for mapping time series data to graphs and complex networks with applications in diverse fields, including medicine. The resulting networks develop a completely different visual acuity that can be used to complement physician findings of time series. This can lead to a more enriched analysis, reduced error, more accurate diagnosis of the disease, and increased accuracy and speed of the treatment process. The mapping process may cause the loss of essential data from the time series and not retain all the time series features. As a result, achieving an approach that can provide a good representation of the time series while maintaining essential features is crucial. This paper proposes a new approach to network development named GraphTS to overcome the limited accuracy of existing methods through EMG time series using the visibility graph method. For this purpose, EMG signals are pre-processed and mapped to a complex network by a standard visibility graph algorithm. The resulting networks can differentiate between healthy and patient samples. In the next step, the properties of the developed networks are given in the form of a feature matrix as input to classifiers after extracting optimal features. Performance evaluation of the proposed approach with deep neural network shows 99.30% accuracy for training data and 99.18% for test data. Therefore, in addition to enriched network representation and covering the features of time series for healthy, myopathy, and neuropathy EMG, the proposed technique improves accuracy, precision, recall, and F-score.
Optimal Sampling Designs for Multi-dimensional Streaming Time Series with Application to Power Grid Sensor Data
Mar 14, 2023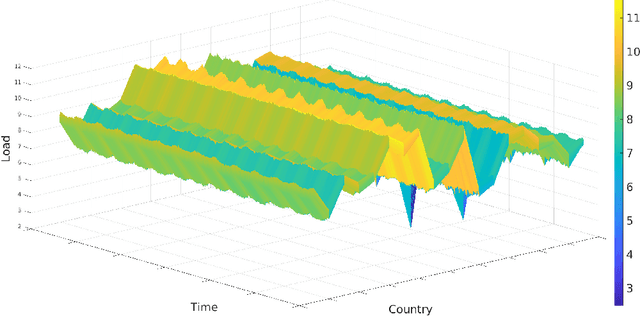
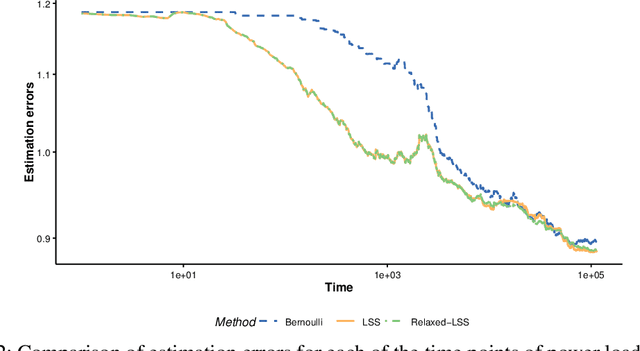
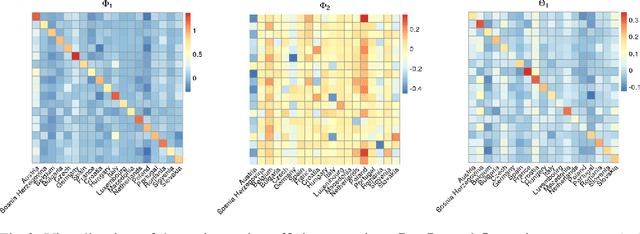
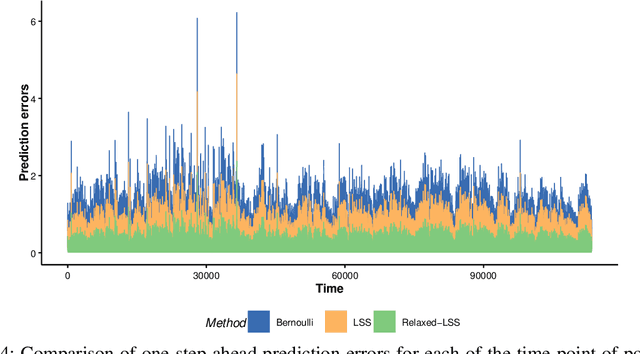
The Internet of Things (IoT) system generates massive high-speed temporally correlated streaming data and is often connected with online inference tasks under computational or energy constraints. Online analysis of these streaming time series data often faces a trade-off between statistical efficiency and computational cost. One important approach to balance this trade-off is sampling, where only a small portion of the sample is selected for the model fitting and update. Motivated by the demands of dynamic relationship analysis of IoT system, we study the data-dependent sample selection and online inference problem for a multi-dimensional streaming time series, aiming to provide low-cost real-time analysis of high-speed power grid electricity consumption data. Inspired by D-optimality criterion in design of experiments, we propose a class of online data reduction methods that achieve an optimal sampling criterion and improve the computational efficiency of the online analysis. We show that the optimal solution amounts to a strategy that is a mixture of Bernoulli sampling and leverage score sampling. The leverage score sampling involves auxiliary estimations that have a computational advantage over recursive least squares updates. Theoretical properties of the auxiliary estimations involved are also discussed. When applied to European power grid consumption data, the proposed leverage score based sampling methods outperform the benchmark sampling method in online estimation and prediction. The general applicability of the sampling-assisted online estimation method is assessed via simulation studies.