 Add to Chrome
 Add to Firefox
 Add to Edge
"Time Series Analysis": models, code, and papers
Soil moisture estimation from Sentinel-1 interferometric observations over arid regions
Oct 18, 2022
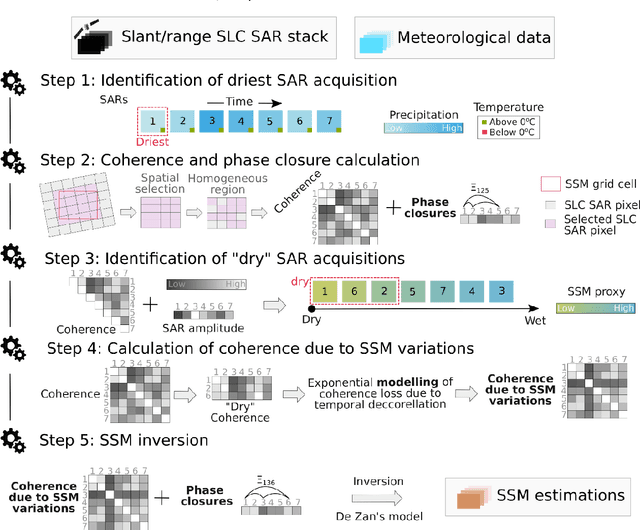
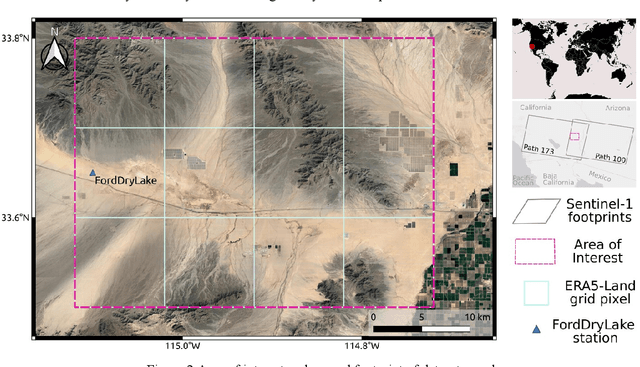
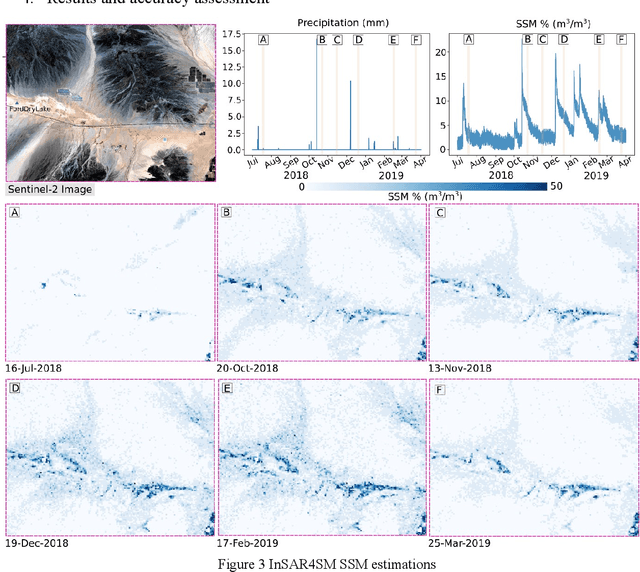
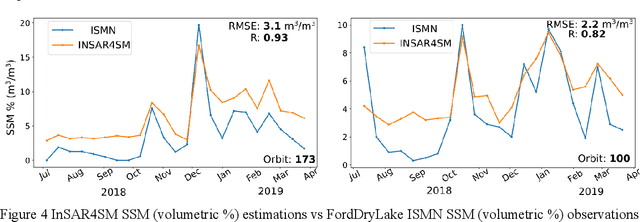
We present a methodology based on interferometric synthetic aperture radar (InSAR) time series analysis that can provide surface (top 5 cm) soil moisture (SSM) estimations. The InSAR time series analysis consists of five processing steps. A co-registered Single Look Complex (SLC) SAR stack as well as meteorological information are required as input of the proposed workflow. In the first step, ice/snow-free and zero-precipitation SAR images are identified using meteorological data. In the second step, construction and phase extraction of distributed scatterers (DSs) (over bare land) is performed. In the third step, for each DS the ordering of surface soil moisture (SSM) levels of SAR acquisitions based on interferometric coherence is calculated. In the fourth step, for each DS the coherence due to SSM variations is calculated. In the fifth step, SSM is estimated by a constrained inversion of an analytical interferometric model using coherence and phase closure information. The implementation of the proposed approach is provided as an open-source software toolbox (INSAR4SM) available at www.github.com/kleok/INSAR4SM. A case study over an arid region in California/Arizona is presented. The proposed workflow was applied in Sentinel- 1 (C-band) VV-polarized InSAR observations. The estimated SSM results were assessed with independent SSM observations from a station of the International Soil Moisture Network (ISMN) (RMSE: 0.027 $m^3/m^3$ R: 0.88) and ERA5-Land reanalysis model data (RMSE: 0.035 $m^3/m^3$ R: 0.71). The proposed methodology was able to provide accurate SSM estimations at high spatial resolution (~250 m). A discussion of the benefits and the limitations of the proposed methodology highlighted the potential of interferometric observables for SSM estimation over arid regions.
Support for Stock Trend Prediction Using Transformers and Sentiment Analysis
May 18, 2023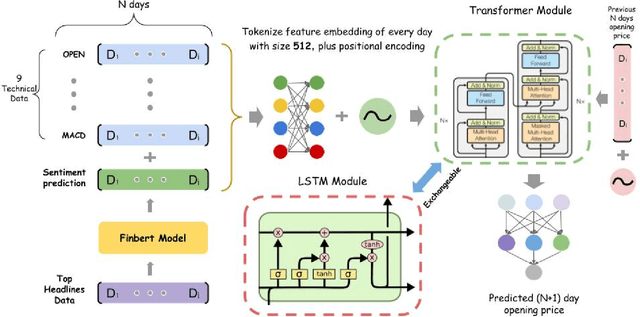
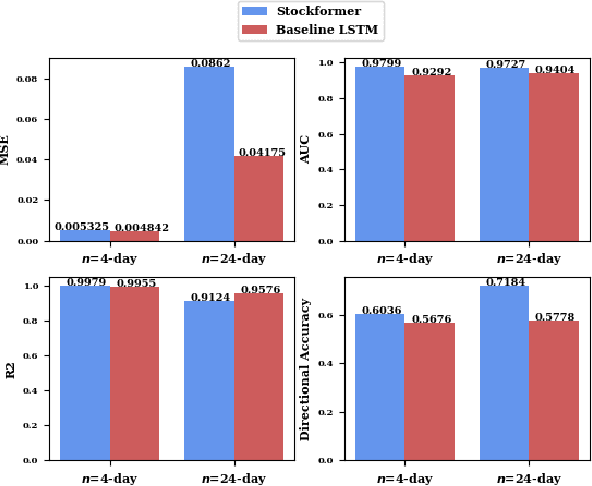
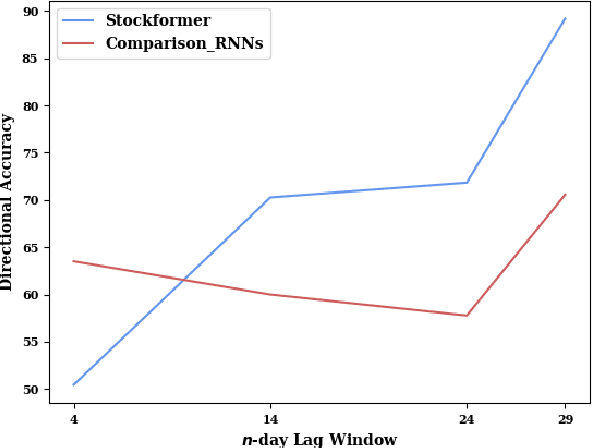
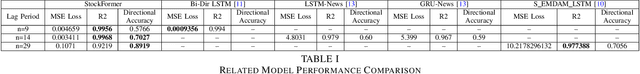
Stock trend analysis has been an influential time-series prediction topic due to its lucrative and inherently chaotic nature. Many models looking to accurately predict the trend of stocks have been based on Recurrent Neural Networks (RNNs). However, due to the limitations of RNNs, such as gradient vanish and long-term dependencies being lost as sequence length increases, in this paper we develop a Transformer based model that uses technical stock data and sentiment analysis to conduct accurate stock trend prediction over long time windows. This paper also introduces a novel dataset containing daily technical stock data and top news headline data spanning almost three years. Stock prediction based solely on technical data can suffer from lag caused by the inability of stock indicators to effectively factor in breaking market news. The use of sentiment analysis on top headlines can help account for unforeseen shifts in market conditions caused by news coverage. We measure the performance of our model against RNNs over sequence lengths spanning 5 business days to 30 business days to mimic different length trading strategies. This reveals an improvement in directional accuracy over RNNs as sequence length is increased, with the largest improvement being close to 18.63% at 30 business days.
Complex-valued Gaussian Process Regression for Time Series Analysis
Dec 07, 2017
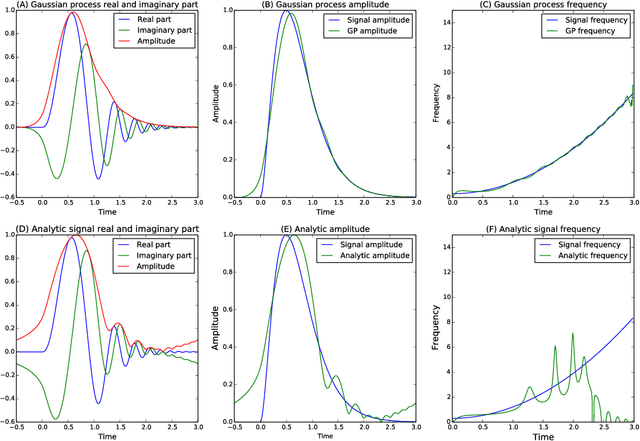
The construction of synthetic complex-valued signals from real-valued observations is an important step in many time series analysis techniques. The most widely used approach is based on the Hilbert transform, which maps the real-valued signal into its quadrature component. In this paper, we define a probabilistic generalization of this approach. We model the observable real-valued signal as the real part of a latent complex-valued Gaussian process. In order to obtain the appropriate statistical relationship between its real and imaginary parts, we define two new classes of complex-valued covariance functions. Through an analysis of simulated chirplets and stochastic oscillations, we show that the resulting Gaussian process complex-valued signal provides a better estimate of the instantaneous amplitude and frequency than the established approaches. Furthermore, the complex-valued Gaussian process regression allows to incorporate prior information about the structure in signal and noise and thereby to tailor the analysis to the features of the signal. As a example, we analyze the non-stationary dynamics of brain oscillations in the alpha band, as measured using magneto-encephalography.
Discovering Communication Pattern Shifts in Large-Scale Networks using Encoder Embedding and Vertex Dynamics
May 03, 2023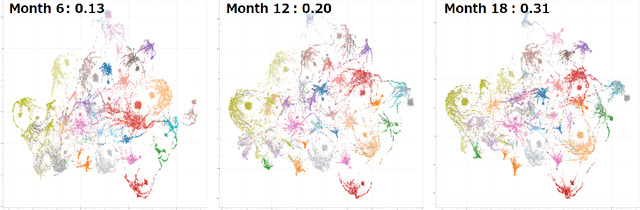
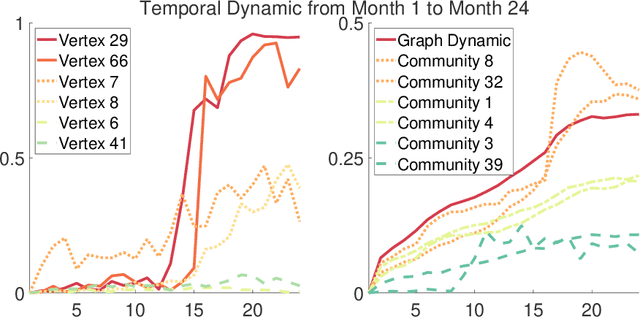
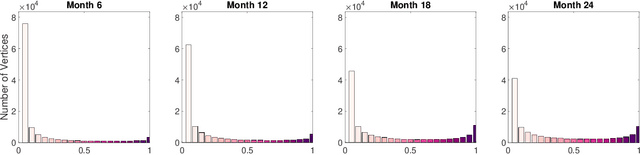
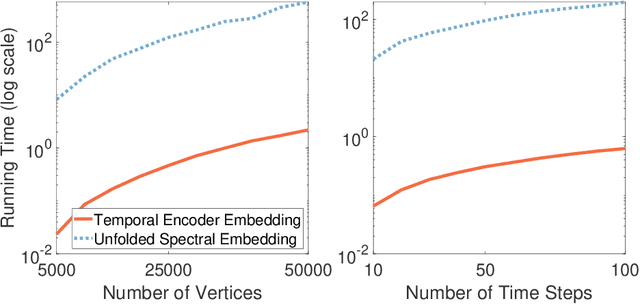
The analysis of large-scale time-series network data, such as social media and email communications, remains a significant challenge for graph analysis methodology. In particular, the scalability of graph analysis is a critical issue hindering further progress in large-scale downstream inference. In this paper, we introduce a novel approach called "temporal encoder embedding" that can efficiently embed large amounts of graph data with linear complexity. We apply this method to an anonymized time-series communication network from a large organization spanning 2019-2020, consisting of over 100 thousand vertices and 80 million edges. Our method embeds the data within 10 seconds on a standard computer and enables the detection of communication pattern shifts for individual vertices, vertex communities, and the overall graph structure. Through supporting theory and synthesis studies, we demonstrate the theoretical soundness of our approach under random graph models and its numerical effectiveness through simulation studies.
Autoregressive models for biomedical signal processing
Apr 17, 2023
Autoregressive models are ubiquitous tools for the analysis of time series in many domains such as computational neuroscience and biomedical engineering. In these domains, data is, for example, collected from measurements of brain activity. Crucially, this data is subject to measurement errors as well as uncertainties in the underlying system model. As a result, standard signal processing using autoregressive model estimators may be biased. We present a framework for autoregressive modelling that incorporates these uncertainties explicitly via an overparameterised loss function. To optimise this loss, we derive an algorithm that alternates between state and parameter estimation. Our work shows that the procedure is able to successfully denoise time series and successfully reconstruct system parameters. This new paradigm can be used in a multitude of applications in neuroscience such as brain-computer interface data analysis and better understanding of brain dynamics in diseases such as epilepsy.
Generic Variance Bounds on Estimation and Prediction Errors in Time Series Analysis: An Entropy Perspective
Apr 15, 2019In this paper, we obtain generic bounds on the variances of estimation and prediction errors in time series analysis via an information-theoretic approach. It is seen in general that the error bounds are determined by the conditional entropy of the data point to be estimated or predicted given the side information or past observations. Additionally, we discover that in order to achieve the prediction error bounds asymptotically, the necessary and sufficient condition is that the "innovation" is asymptotically white Gaussian. When restricted to Gaussian processes and 1-step prediction, our bounds are shown to reduce to the Kolmogorov-Szeg\"o formula and Wiener-Masani formula known from linear prediction theory.
LTC-SE: Expanding the Potential of Liquid Time-Constant Neural Networks for Scalable AI and Embedded Systems
Apr 18, 2023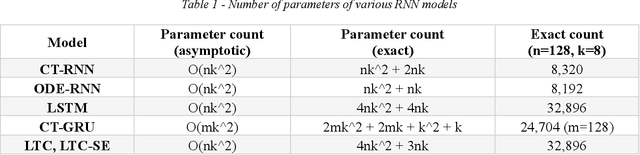
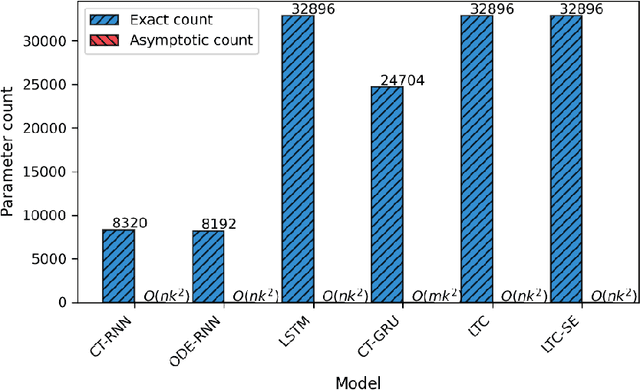
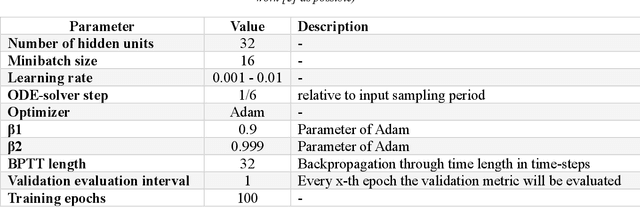
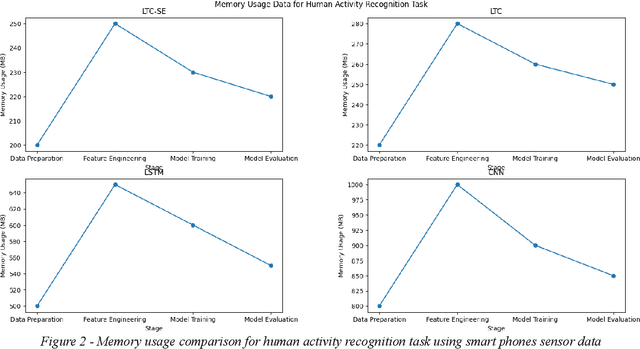
We present LTC-SE, an improved version of the Liquid Time-Constant (LTC) neural network algorithm originally proposed by Hasani et al. in 2021. This algorithm unifies the Leaky-Integrate-and-Fire (LIF) spiking neural network model with Continuous-Time Recurrent Neural Networks (CTRNNs), Neural Ordinary Differential Equations (NODEs), and bespoke Gated Recurrent Units (GRUs). The enhancements in LTC-SE focus on augmenting flexibility, compatibility, and code organization, targeting the unique constraints of embedded systems with limited computational resources and strict performance requirements. The updated code serves as a consolidated class library compatible with TensorFlow 2.x, offering comprehensive configuration options for LTCCell, CTRNN, NODE, and CTGRU classes. We evaluate LTC-SE against its predecessors, showcasing the advantages of our optimizations in user experience, Keras function compatibility, and code clarity. These refinements expand the applicability of liquid neural networks in diverse machine learning tasks, such as robotics, causality analysis, and time-series prediction, and build on the foundational work of Hasani et al.
Stack Index Prediction Using Time-Series Analysis
Aug 18, 2021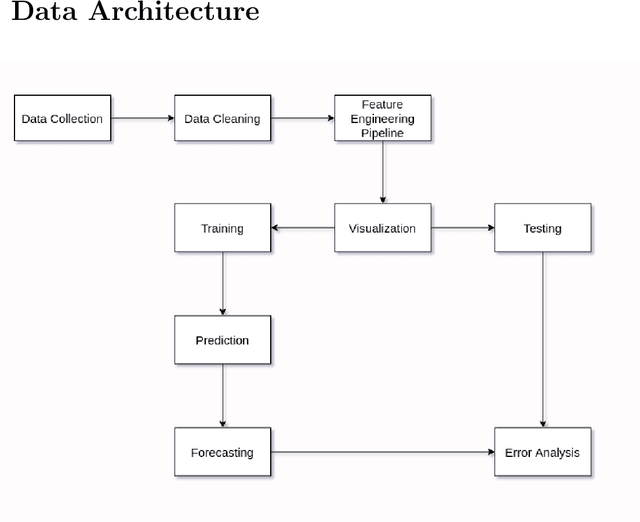
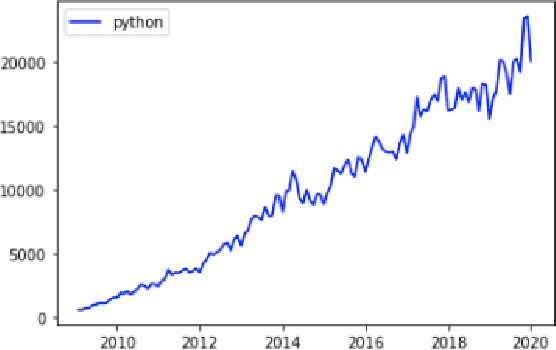
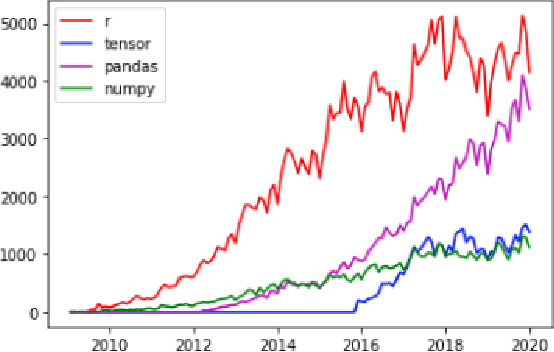
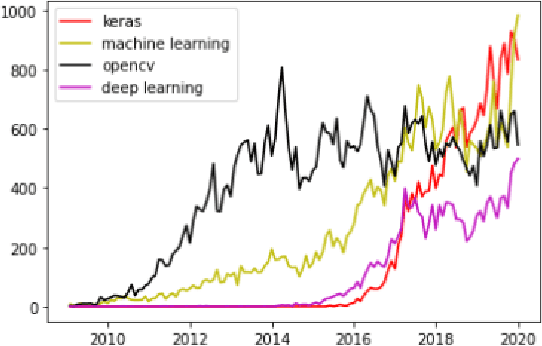
The Prevalence of Community support and engagement for different domains in the tech industry has changed and evolved throughout the years. In this study, we aim to understand, analyze and predict the trends of technology in a scientific manner, having collected data on numerous topics and their growth throughout the years in the past decade. We apply machine learning models on collected data, to understand, analyze and forecast the trends in the advancement of different fields. We show that certain technical concepts such as python, machine learning, and Keras have an undisputed uptrend, finally concluding that the Stackindex model forecasts with high accuracy and can be a viable tool for forecasting different tech domains.
Regions of Reliability in the Evaluation of Multivariate Probabilistic Forecasts
Apr 19, 2023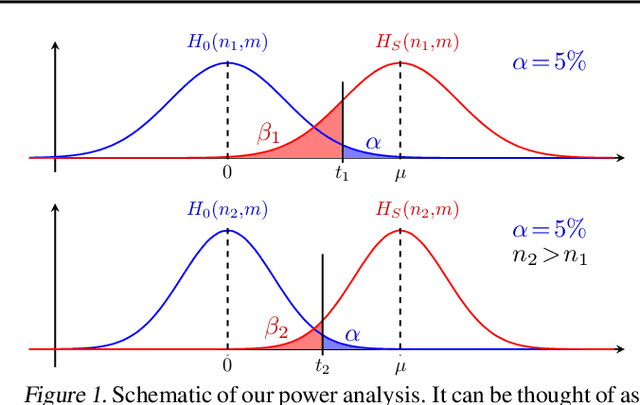
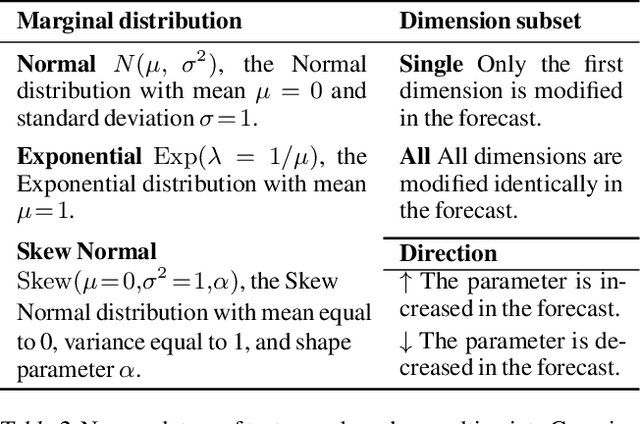
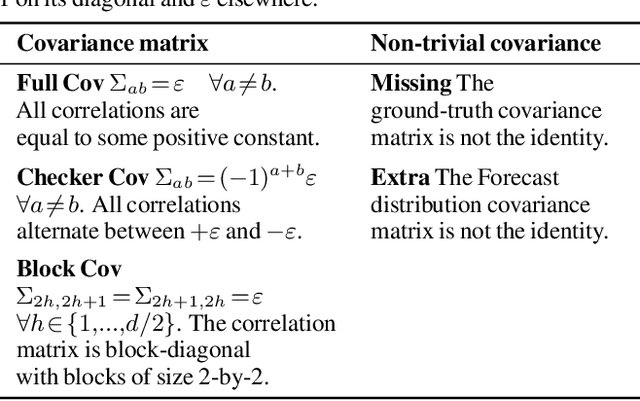
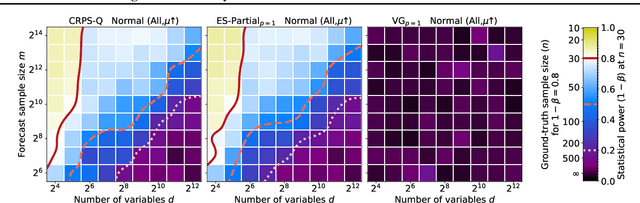
Multivariate probabilistic time series forecasts are commonly evaluated via proper scoring rules, i.e., functions that are minimal in expectation for the ground-truth distribution. However, this property is not sufficient to guarantee good discrimination in the non-asymptotic regime. In this paper, we provide the first systematic finite-sample study of proper scoring rules for time-series forecasting evaluation. Through a power analysis, we identify the "region of reliability" of a scoring rule, i.e., the set of practical conditions where it can be relied on to identify forecasting errors. We carry out our analysis on a comprehensive synthetic benchmark, specifically designed to test several key discrepancies between ground-truth and forecast distributions, and we gauge the generalizability of our findings to real-world tasks with an application to an electricity production problem. Our results reveal critical shortcomings in the evaluation of multivariate probabilistic forecasts as commonly performed in the literature.
Retrieval Based Time Series Forecasting
Sep 27, 2022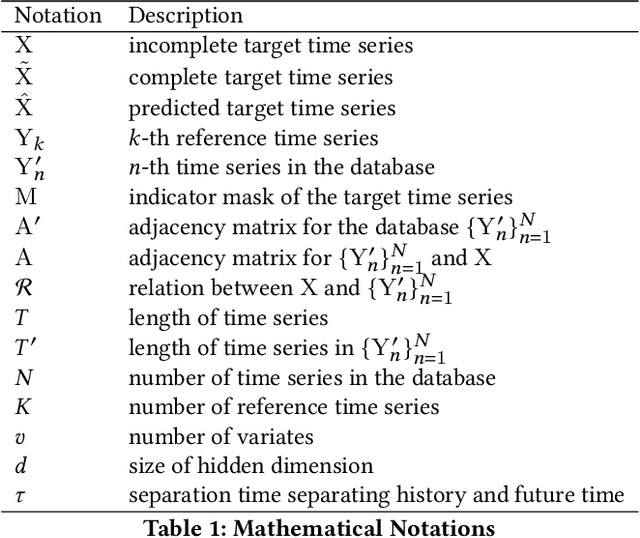
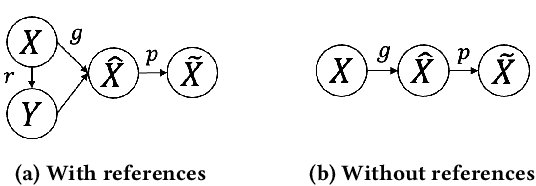
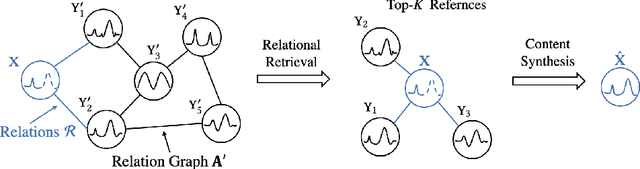
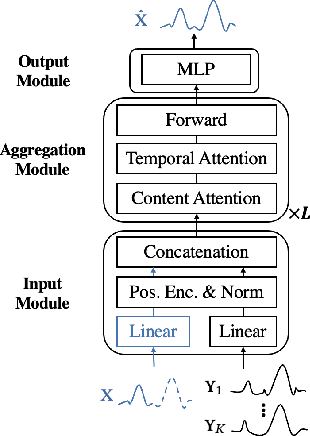
Time series data appears in a variety of applications such as smart transportation and environmental monitoring. One of the fundamental problems for time series analysis is time series forecasting. Despite the success of recent deep time series forecasting methods, they require sufficient observation of historical values to make accurate forecasting. In other words, the ratio of the output length (or forecasting horizon) to the sum of the input and output lengths should be low enough (e.g., 0.3). As the ratio increases (e.g., to 0.8), the uncertainty for the forecasting accuracy increases significantly. In this paper, we show both theoretically and empirically that the uncertainty could be effectively reduced by retrieving relevant time series as references. In the theoretical analysis, we first quantify the uncertainty and show its connections to the Mean Squared Error (MSE). Then we prove that models with references are easier to learn than models without references since the retrieved references could reduce the uncertainty. To empirically demonstrate the effectiveness of the retrieval based time series forecasting models, we introduce a simple yet effective two-stage method, called ReTime consisting of a relational retrieval and a content synthesis. We also show that ReTime can be easily adapted to the spatial-temporal time series and time series imputation settings. Finally, we evaluate ReTime on real-world datasets to demonstrate its effectiveness.