 Add to Chrome
 Add to Firefox
 Add to Edge
"Time Series Analysis": models, code, and papers
Testing for the Markov Property in Time Series via Deep Conditional Generative Learning
May 30, 2023
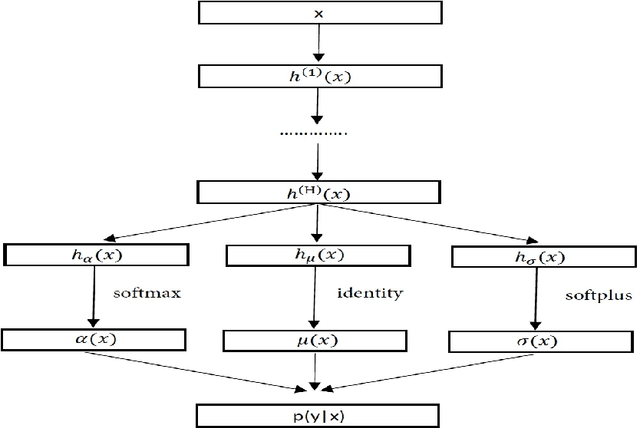
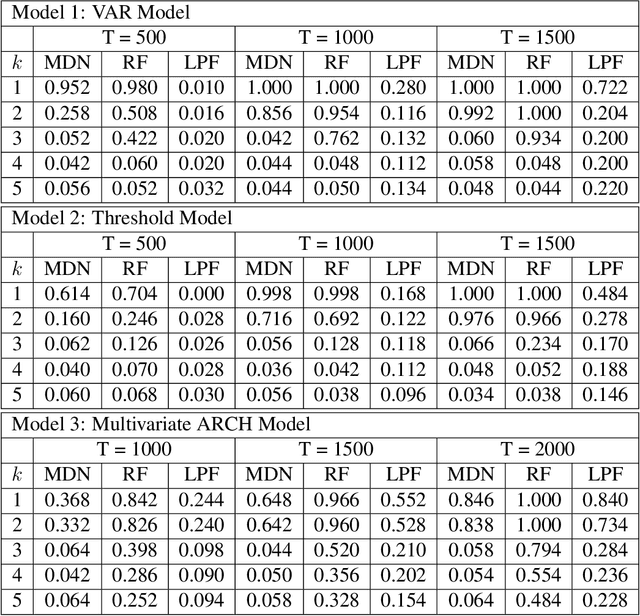
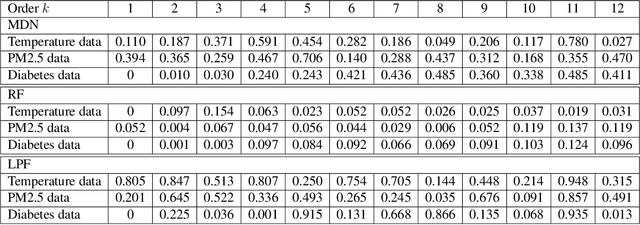
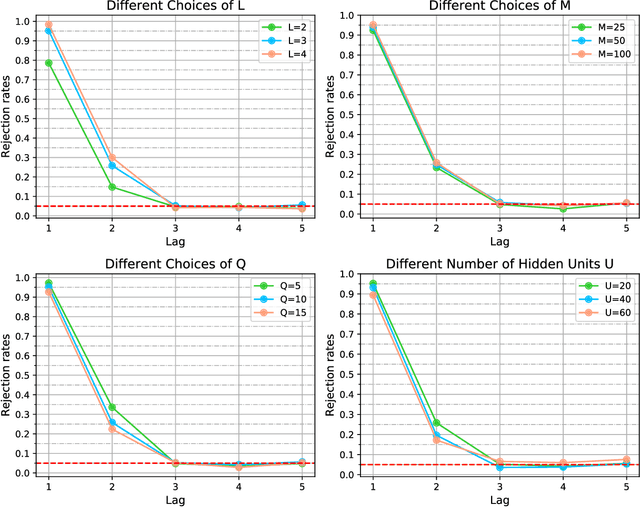
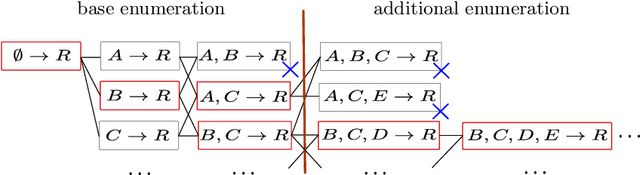
The Markov property is widely imposed in analysis of time series data. Correspondingly, testing the Markov property, and relatedly, inferring the order of a Markov model, are of paramount importance. In this article, we propose a nonparametric test for the Markov property in high-dimensional time series via deep conditional generative learning. We also apply the test sequentially to determine the order of the Markov model. We show that the test controls the type-I error asymptotically, and has the power approaching one. Our proposal makes novel contributions in several ways. We utilize and extend state-of-the-art deep generative learning to estimate the conditional density functions, and establish a sharp upper bound on the approximation error of the estimators. We derive a doubly robust test statistic, which employs a nonparametric estimation but achieves a parametric convergence rate. We further adopt sample splitting and cross-fitting to minimize the conditions required to ensure the consistency of the test. We demonstrate the efficacy of the test through both simulations and the three data applications.
Machine Learning with Probabilistic Law Discovery: A Concise Introduction
Dec 22, 2022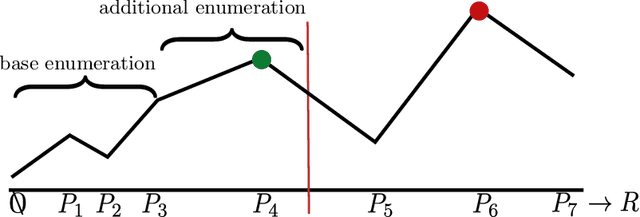
Probabilistic Law Discovery (PLD) is a logic based Machine Learning method, which implements a variant of probabilistic rule learning. In several aspects, PLD is close to Decision Tree/Random Forest methods, but it differs significantly in how relevant rules are defined. The learning procedure of PLD solves the optimization problem related to the search for rules (called probabilistic laws), which have a minimal length and relatively high probability. At inference, ensembles of these rules are used for prediction. Probabilistic laws are human-readable and PLD based models are transparent and inherently interpretable. Applications of PLD include classification/clusterization/regression tasks, as well as time series analysis/anomaly detection and adaptive (robotic) control. In this paper, we outline the main principles of PLD, highlight its benefits and limitations and provide some application guidelines.
T-WaveNet: Tree-Structured Wavelet Neural Network for Sensor-Based Time Series Analysis
Dec 10, 2020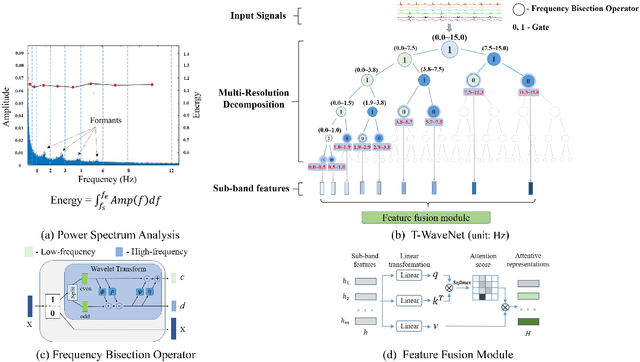
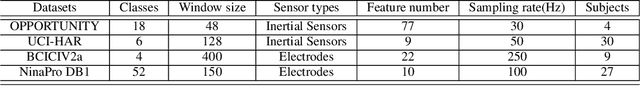
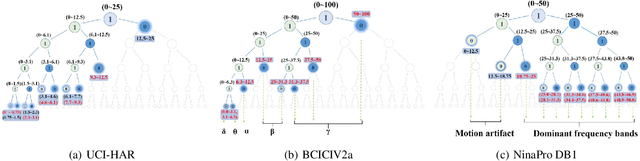
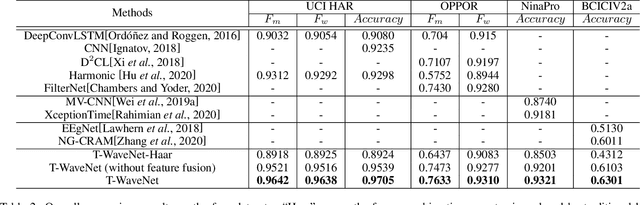
Sensor-based time series analysis is an essential task for applications such as activity recognition and brain-computer interface. Recently, features extracted with deep neural networks (DNNs) are shown to be more effective than conventional hand-crafted ones. However, most of these solutions rely solely on the network to extract application-specific information carried in the sensor data. Motivated by the fact that usually a small subset of the frequency components carries the primary information for sensor data, we propose a novel tree-structured wavelet neural network for sensor data analysis, namely \emph{T-WaveNet}. To be specific, with T-WaveNet, we first conduct a power spectrum analysis for the sensor data and decompose the input signal into various frequency subbands accordingly. Then, we construct a tree-structured network, and each node on the tree (corresponding to a frequency subband) is built with an invertible neural network (INN) based wavelet transform. By doing so, T-WaveNet provides more effective representation for sensor information than existing DNN-based techniques, and it achieves state-of-the-art performance on various sensor datasets, including UCI-HAR for activity recognition, OPPORTUNITY for gesture recognition, BCICIV2a for intention recognition, and NinaPro DB1 for muscular movement recognition.
Neural Differential Recurrent Neural Network with Adaptive Time Steps
Jun 02, 2023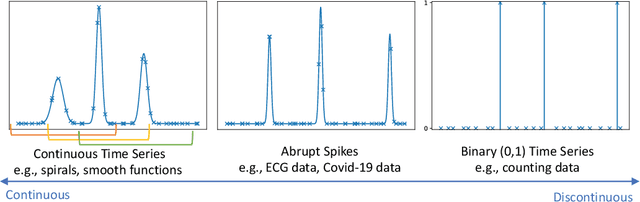
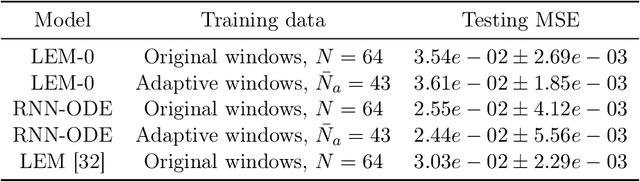
The neural Ordinary Differential Equation (ODE) model has shown success in learning complex continuous-time processes from observations on discrete time stamps. In this work, we consider the modeling and forecasting of time series data that are non-stationary and may have sharp changes like spikes. We propose an RNN-based model, called RNN-ODE-Adap, that uses a neural ODE to represent the time development of the hidden states, and we adaptively select time steps based on the steepness of changes of the data over time so as to train the model more efficiently for the "spike-like" time series. Theoretically, RNN-ODE-Adap yields provably a consistent estimation of the intensity function for the Hawkes-type time series data. We also provide an approximation analysis of the RNN-ODE model showing the benefit of adaptive steps. The proposed model is demonstrated to achieve higher prediction accuracy with reduced computational cost on simulated dynamic system data and point process data and on a real electrocardiography dataset.
Non-Asymptotic Pointwise and Worst-Case Bounds for Classical Spectrum Estimators
Mar 21, 2023Spectrum estimation is a fundamental methodology in the analysis of time-series data, with applications including medicine, speech analysis, and control design. The asymptotic theory of spectrum estimation is well-understood, but the theory is limited when the number of samples is fixed and finite. This paper gives non-asymptotic error bounds for a broad class of spectral estimators, both pointwise (at specific frequencies) and in the worst case over all frequencies. The general method is used to derive error bounds for the classical Blackman-Tukey, Bartlett, and Welch estimators.
Highly comparative time-series analysis: The empirical structure of time series and their methods
Apr 03, 2013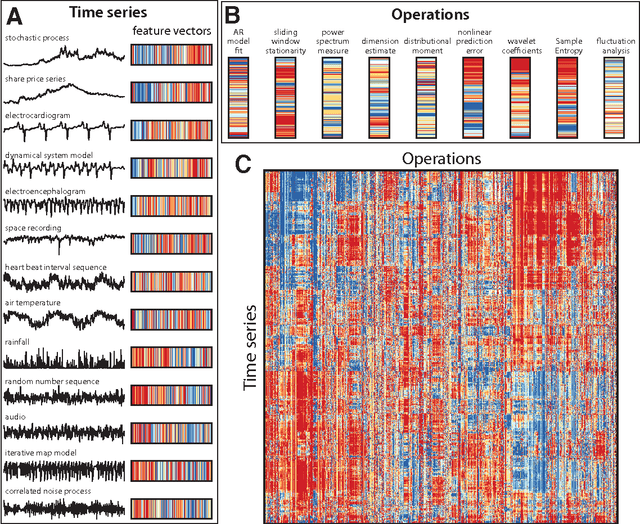
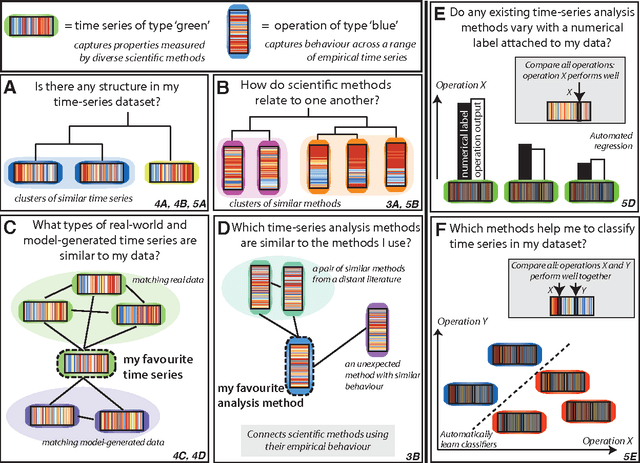
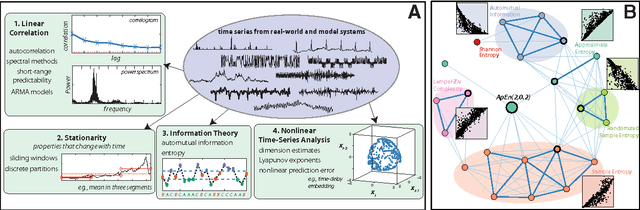
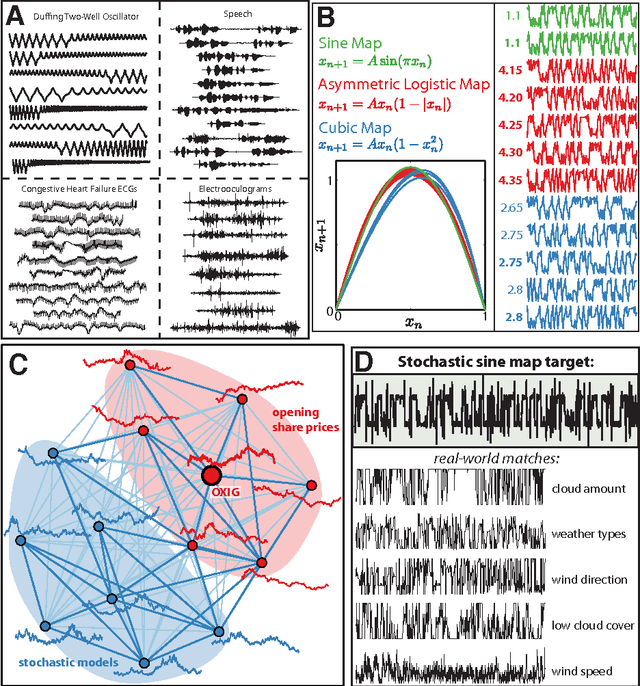
The process of collecting and organizing sets of observations represents a common theme throughout the history of science. However, despite the ubiquity of scientists measuring, recording, and analyzing the dynamics of different processes, an extensive organization of scientific time-series data and analysis methods has never been performed. Addressing this, annotated collections of over 35 000 real-world and model-generated time series and over 9000 time-series analysis algorithms are analyzed in this work. We introduce reduced representations of both time series, in terms of their properties measured by diverse scientific methods, and of time-series analysis methods, in terms of their behaviour on empirical time series, and use them to organize these interdisciplinary resources. This new approach to comparing across diverse scientific data and methods allows us to organize time-series datasets automatically according to their properties, retrieve alternatives to particular analysis methods developed in other scientific disciplines, and automate the selection of useful methods for time-series classification and regression tasks. The broad scientific utility of these tools is demonstrated on datasets of electroencephalograms, self-affine time series, heart beat intervals, speech signals, and others, in each case contributing novel analysis techniques to the existing literature. Highly comparative techniques that compare across an interdisciplinary literature can thus be used to guide more focused research in time-series analysis for applications across the scientific disciplines.
An Attention Free Long Short-Term Memory for Time Series Forecasting
Sep 20, 2022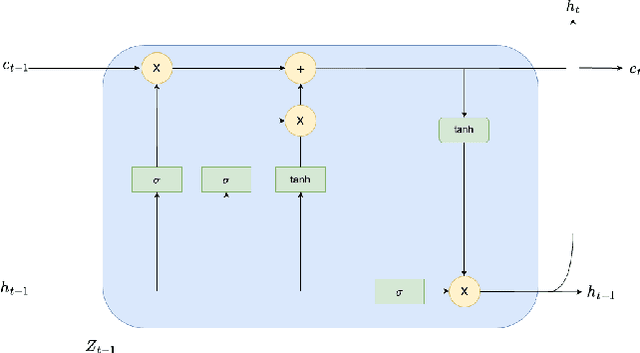
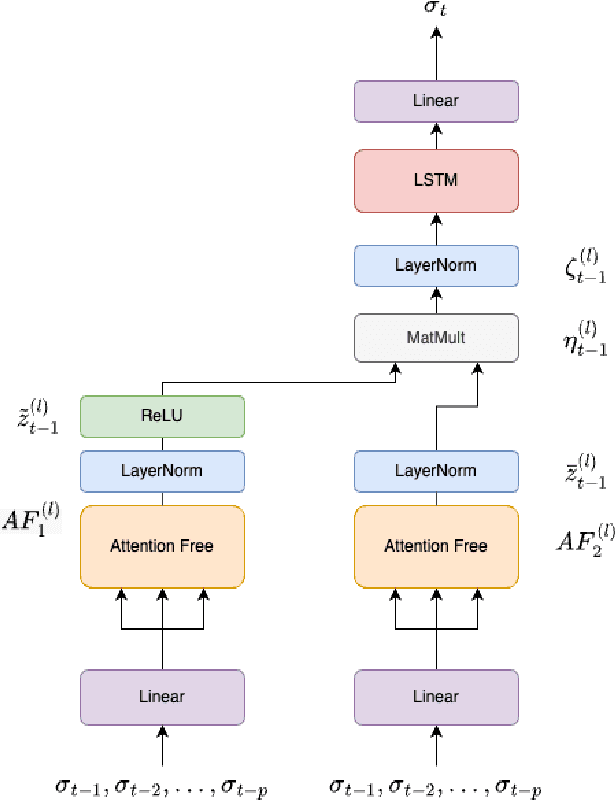
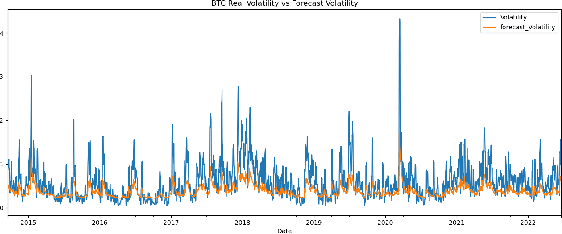
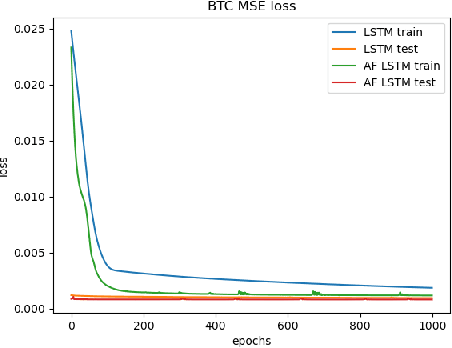
Deep learning is playing an increasingly important role in time series analysis. We focused on time series forecasting using attention free mechanism, a more efficient framework, and proposed a new architecture for time series prediction for which linear models seem to be unable to capture the time dependence. We proposed an architecture built using attention free LSTM layers that overcome linear models for conditional variance prediction. Our findings confirm the validity of our model, which also allowed to improve the prediction capacity of a LSTM, while improving the efficiency of the learning task.
Geodesic Properties of a Generalized Wasserstein Embedding for Time Series Analysis
Jun 04, 2022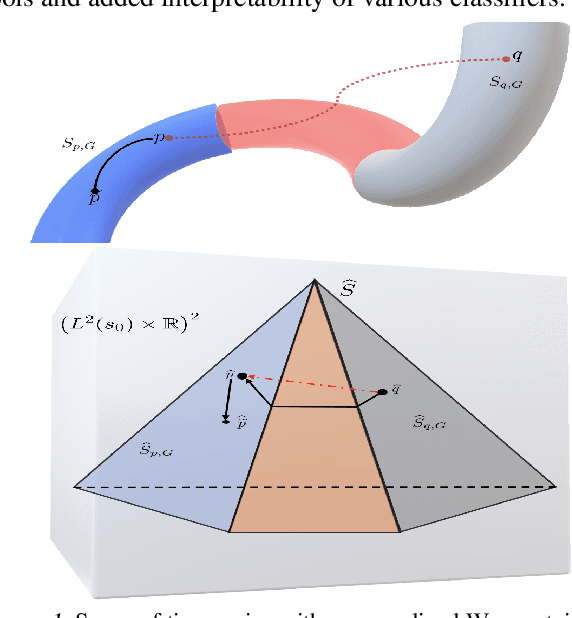
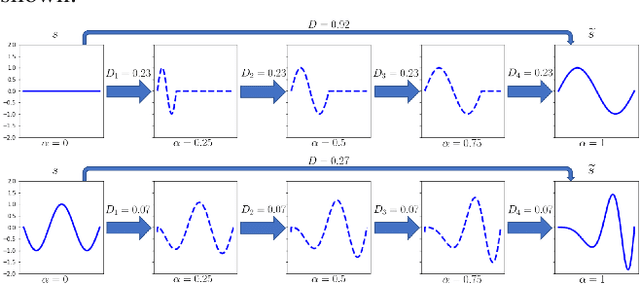
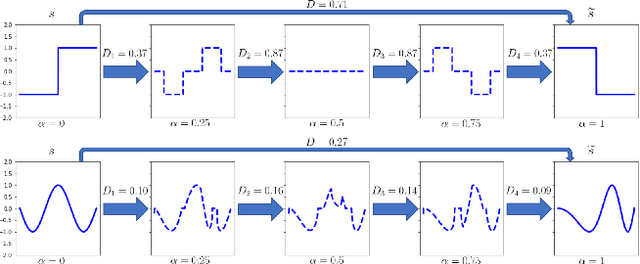
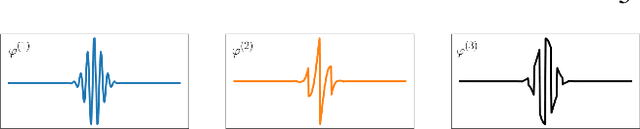
Transport-based metrics and related embeddings (transforms) have recently been used to model signal classes where nonlinear structures or variations are present. In this paper, we study the geodesic properties of time series data with a generalized Wasserstein metric and the geometry related to their signed cumulative distribution transforms in the embedding space. Moreover, we show how understanding such geometric characteristics can provide added interpretability to certain time series classifiers, and be an inspiration for more robust classifiers.
PyPOTS: A Python Toolbox for Data Mining on Partially-Observed Time Series
May 30, 2023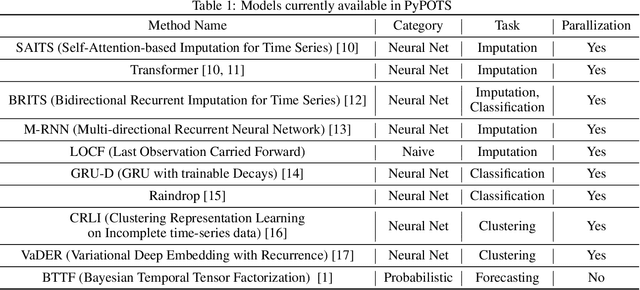
PyPOTS is an open-source Python library dedicated to data mining and analysis on multivariate partially-observed time series, i.e. incomplete time series with missing values, A.K.A. irregularlysampled time series. Particularly, it provides easy access to diverse algorithms categorized into four tasks: imputation, classification, clustering, and forecasting. The included models contain probabilistic approaches as well as neural-network methods, with a well-designed and fully-documented programming interface for both academic researchers and industrial professionals to use. With robustness and scalability in its design philosophy, best practices of software construction, for example, unit testing, continuous integration (CI) and continuous delivery (CD), code coverage, maintainability evaluation, interactive tutorials, and parallelization, are carried out as principles during the development of PyPOTS. The toolkit is available on both Python Package Index (PyPI) and Anaconda. PyPOTS is open-source and publicly available on GitHub https://github.com/WenjieDu/PyPOTS.
Application of Time Series Analysis to Traffic Accidents in Los Angeles
Nov 28, 2019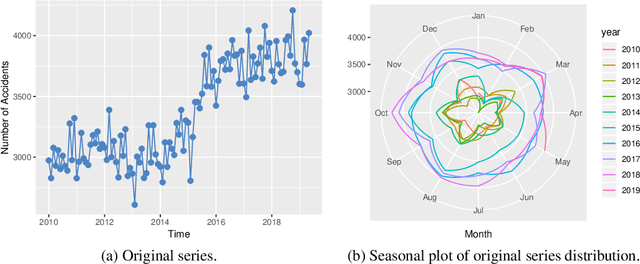
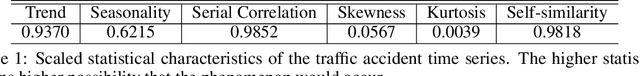
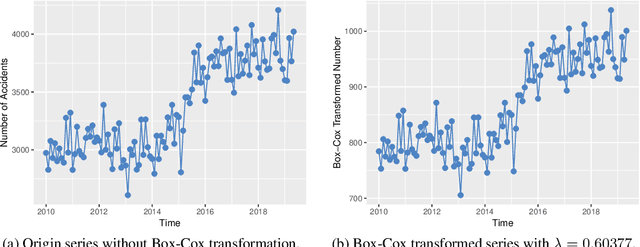
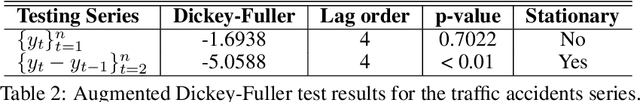
With the improvements of Los Angeles in many aspects, people in mounting numbers tend to live or travel to the city. The primary objective of this paper is to apply a set of methods for the time series analysis of traffic accidents in Los Angeles in the past few years. The number of traffic accidents, collected from 2010 to 2019 monthly reveals that the traffic accident happens seasonally and increasing with fluctuation. This paper utilizes the ensemble methods to combine several different methods to model the data from various perspectives, which can lead to better forecasting accuracy. The IMA(1, 1), ETS(A, N, A), and two models with Fourier items are failed in independence assumption checking. However, the Online Gradient Descent (OGD) model generated by the ensemble method shows the perfect fit in the data modeling, which is the state-of-the-art model among our candidate models. Therefore, it can be easier to accurately forecast future traffic accidents based on previous data through our model, which can help designers to make better plans.