 Add to Chrome
 Add to Firefox
 Add to Edge
"Time Series Analysis": models, code, and papers
Singular spectrum analysis of time series data from low frequency radiometers, with an application to SITARA data
Feb 15, 2023
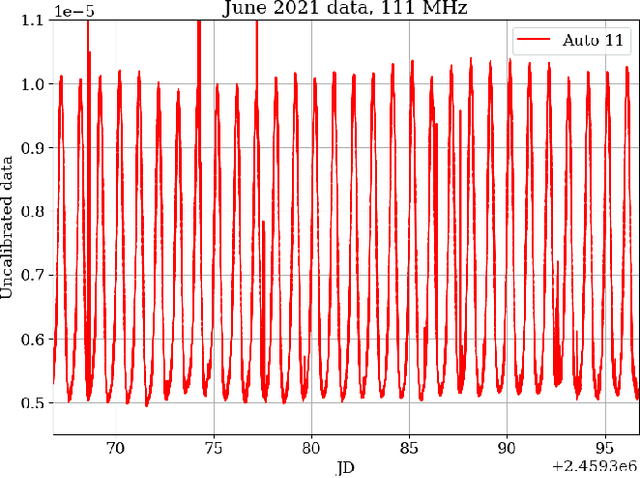
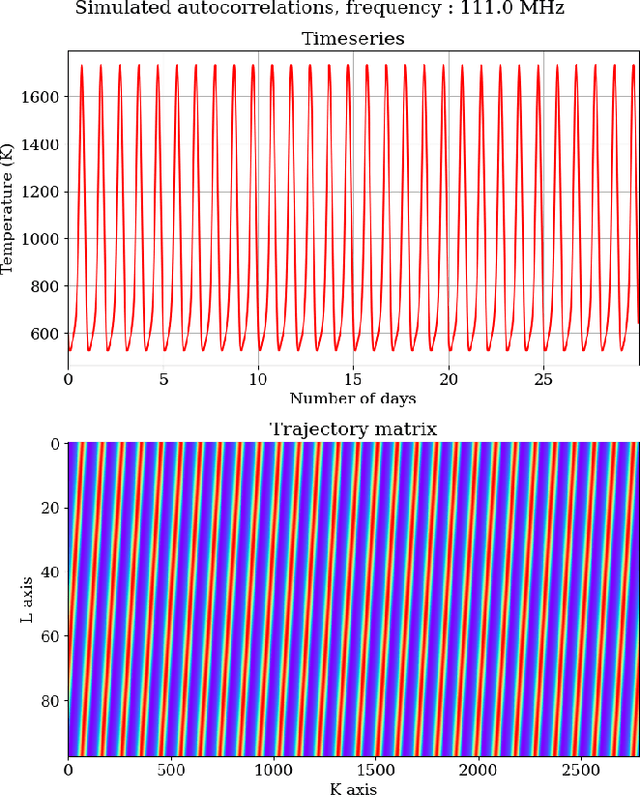
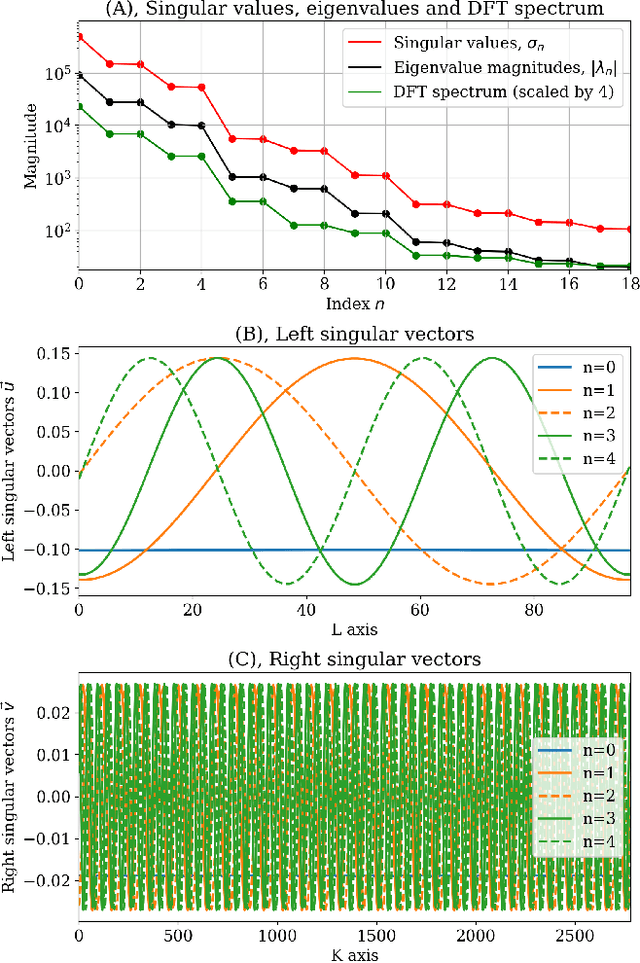
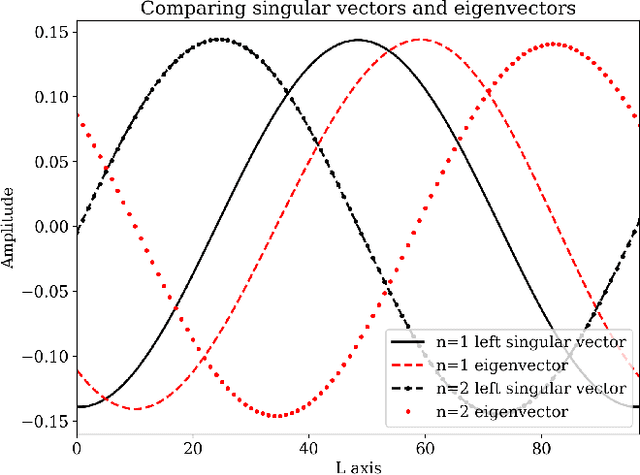
Understanding the temporal characteristics of data from low frequency radio telescopes is of importance in devising suitable calibration strategies. Application of time series analysis techniques to data from radio telescopes can reveal a wealth of information that can aid in calibration. In this paper, we investigate singular spectrum analysis (SSA) as an analysis tool for radio data. We show the intimate connection between SSA and Fourier techniques. We develop the relevant mathematics starting with an idealised periodic dataset and proceeding to include various non-ideal behaviours. We propose a novel technique to obtain long-term gain changes in data, leveraging the periodicity arising from sky drift through the antenna beams. We also simulate several plausible scenarios and apply the techniques to a 30-day time series data collected during June 2021 from SITARA - a short-spacing two element interferometer for global 21-cm detection. Applying the techniques to real data, we find that the first reconstructed component - the trend - has a strong anti-correlation with the local temperature suggesting temperature fluctuations as the most likely origin for the observed variations in the data. We also study the limitations of the calibration in the presence of diurnal gain variations and find that such variations are the likely impediment to calibrating SITARA data with SSA.
SimMTM: A Simple Pre-Training Framework for Masked Time-Series Modeling
Feb 03, 2023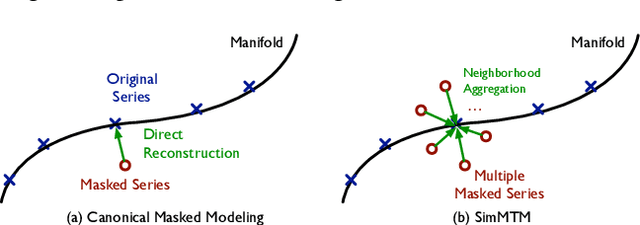
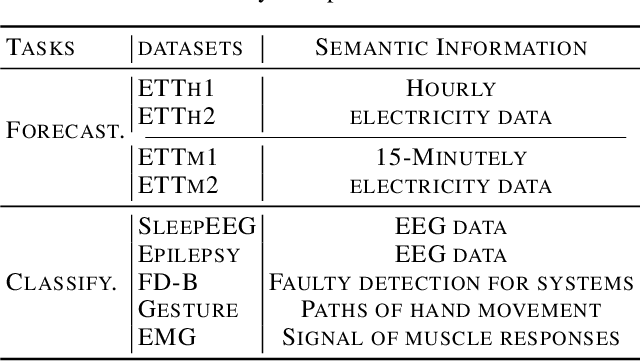
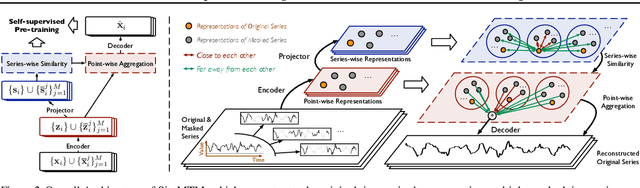
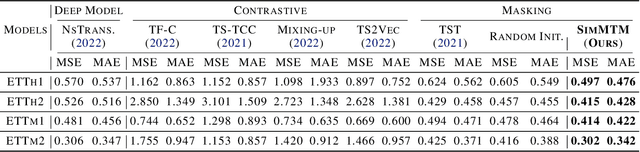
Time series analysis is widely used in extensive areas. Recently, to reduce labeling expenses and benefit various tasks, self-supervised pre-training has attracted immense interest. One mainstream paradigm is masked modeling, which successfully pre-trains deep models by learning to reconstruct the masked content based on the unmasked part. However, since the semantic information of time series is mainly contained in temporal variations, the standard way of randomly masking a portion of time points will ruin vital temporal variations of time series seriously, making the reconstruction task too difficult to guide representation learning. We thus present SimMTM, a Simple pre-training framework for Masked Time-series Modeling. By relating masked modeling to manifold learning, SimMTM proposes to recover masked time points by the weighted aggregation of multiple neighbors outside the manifold, which eases the reconstruction task by assembling ruined but complementary temporal variations from multiple masked series. SimMTM further learns to uncover the local structure of the manifold helpful for masked modeling. Experimentally, SimMTM achieves state-of-the-art fine-tuning performance in two canonical time series analysis tasks: forecasting and classification, covering both in- and cross-domain settings.
Predicting Unplanned Readmissions in the Intensive Care Unit: A Multimodality Evaluation
May 14, 2023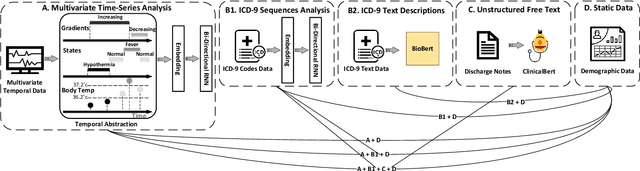
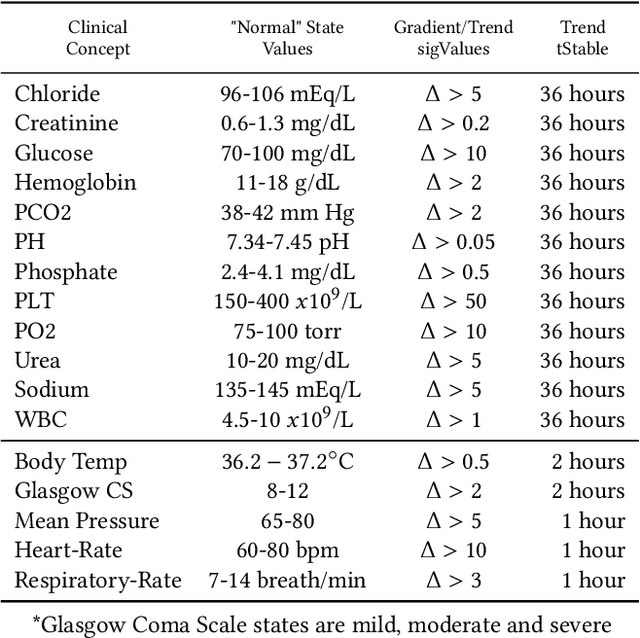
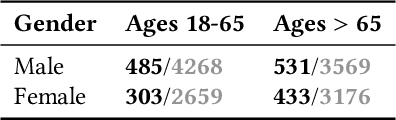
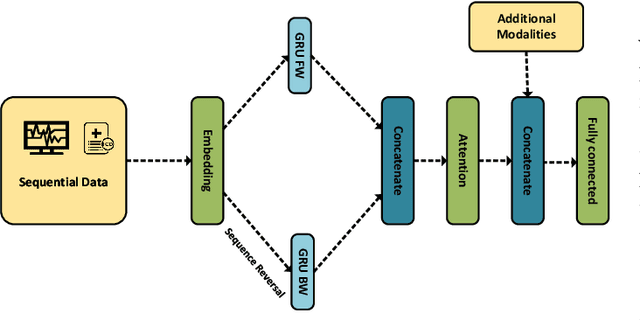
A hospital readmission is when a patient who was discharged from the hospital is admitted again for the same or related care within a certain period. Hospital readmissions are a significant problem in the healthcare domain, as they lead to increased hospitalization costs, decreased patient satisfaction, and increased risk of adverse outcomes such as infections, medication errors, and even death. The problem of hospital readmissions is particularly acute in intensive care units (ICUs), due to the severity of the patients' conditions, and the substantial risk of complications. Predicting Unplanned Readmissions in ICUs is a challenging task, as it involves analyzing different data modalities, such as static data, unstructured free text, sequences of diagnoses and procedures, and multivariate time-series. Here, we investigate the effectiveness of each data modality separately, then alongside with others, using state-of-the-art machine learning approaches in time-series analysis and natural language processing. Using our evaluation process, we are able to determine the contribution of each data modality, and for the first time in the context of readmission, establish a hierarchy of their predictive value. Additionally, we demonstrate the impact of Temporal Abstractions in enhancing the performance of time-series approaches to readmission prediction. Due to conflicting definitions in the literature, we also provide a clear definition of the term Unplanned Readmission to enhance reproducibility and consistency of future research and to prevent any potential misunderstandings that could result from diverse interpretations of the term. Our experimental results on a large benchmark clinical data set show that Discharge Notes written by physicians, have better capabilities for readmission prediction than all other modalities.
Robustness Verification of Deep Neural Networks using Star-Based Reachability Analysis with Variable-Length Time Series Input
Jul 26, 2023Data-driven, neural network (NN) based anomaly detection and predictive maintenance are emerging research areas. NN-based analytics of time-series data offer valuable insights into past behaviors and estimates of critical parameters like remaining useful life (RUL) of equipment and state-of-charge (SOC) of batteries. However, input time series data can be exposed to intentional or unintentional noise when passing through sensors, necessitating robust validation and verification of these NNs. This paper presents a case study of the robustness verification approach for time series regression NNs (TSRegNN) using set-based formal methods. It focuses on utilizing variable-length input data to streamline input manipulation and enhance network architecture generalizability. The method is applied to two data sets in the Prognostics and Health Management (PHM) application areas: (1) SOC estimation of a Lithium-ion battery and (2) RUL estimation of a turbine engine. The NNs' robustness is checked using star-based reachability analysis, and several performance measures evaluate the effect of bounded perturbations in the input on network outputs, i.e., future outcomes. Overall, the paper offers a comprehensive case study for validating and verifying NN-based analytics of time-series data in real-world applications, emphasizing the importance of robustness testing for accurate and reliable predictions, especially considering the impact of noise on future outcomes.
Reclaiming the Horizon: Novel Visualization Designs for Time-Series Data with Large Value Ranges
Jul 18, 2023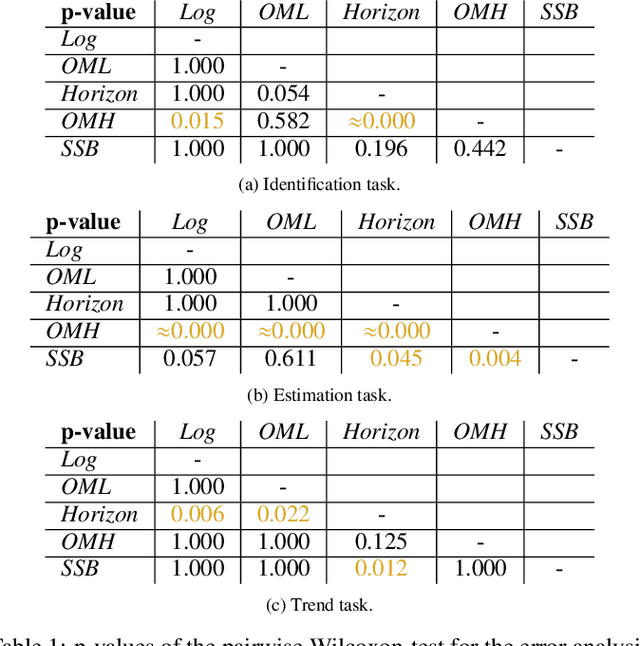
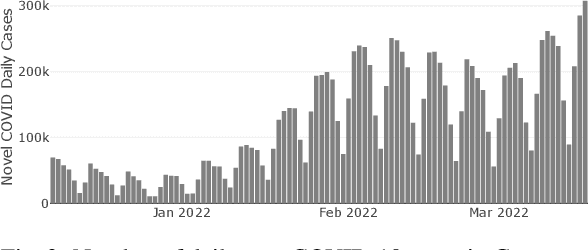
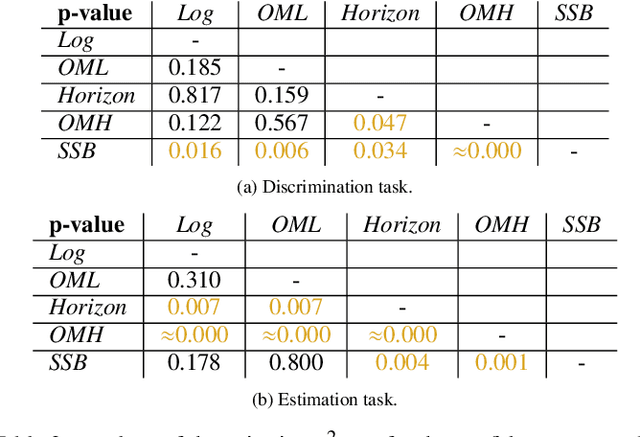
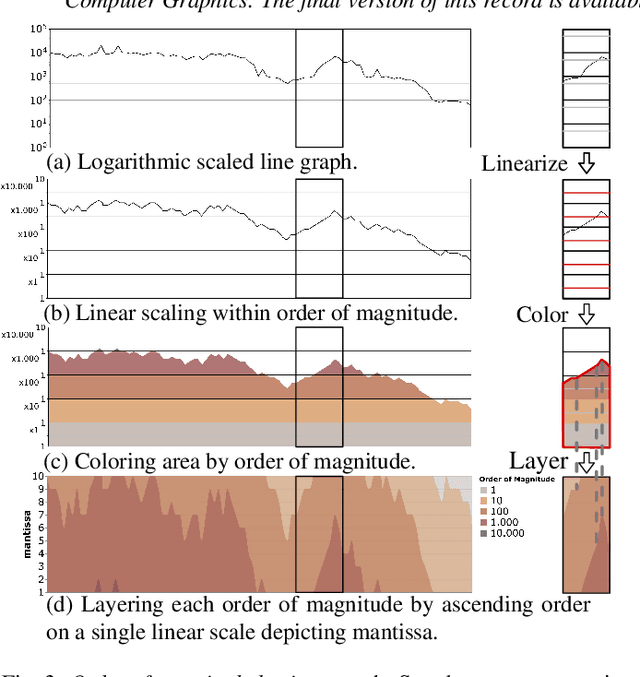
We introduce two novel visualization designs to support practitioners in performing identification and discrimination tasks on large value ranges (i.e., several orders of magnitude) in time-series data: (1) The order of magnitude horizon graph, which extends the classic horizon graph; and (2) the order of magnitude line chart, which adapts the log-line chart. These new visualization designs visualize large value ranges by explicitly splitting the mantissa m and exponent e of a value v = m * 10e . We evaluate our novel designs against the most relevant state-of-the-art visualizations in an empirical user study. It focuses on four main tasks commonly employed in the analysis of time-series and large value ranges visualization: identification, discrimination, estimation, and trend detection. For each task we analyse error, confidence, and response time. The new order of magnitude horizon graph performs better or equal to all other designs in identification, discrimination, and estimation tasks. Only for trend detection tasks, the more traditional horizon graphs reported better performance. Our results are domain-independent, only requiring time-series data with large value ranges.
Unsupervised Representation Learning for Time Series: A Review
Aug 03, 2023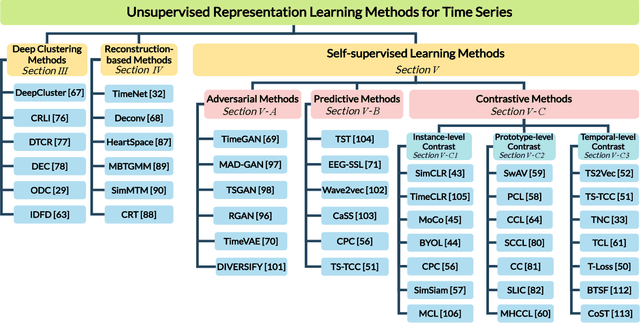
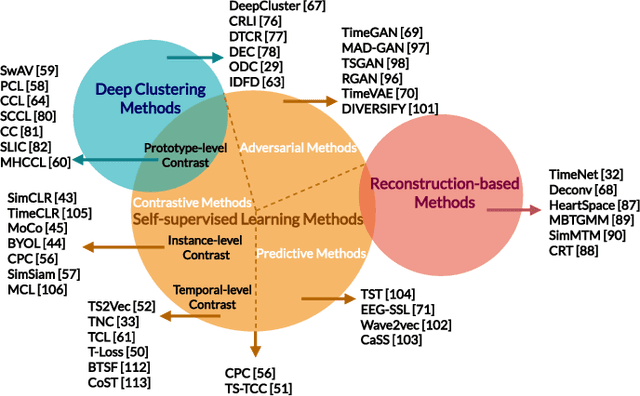
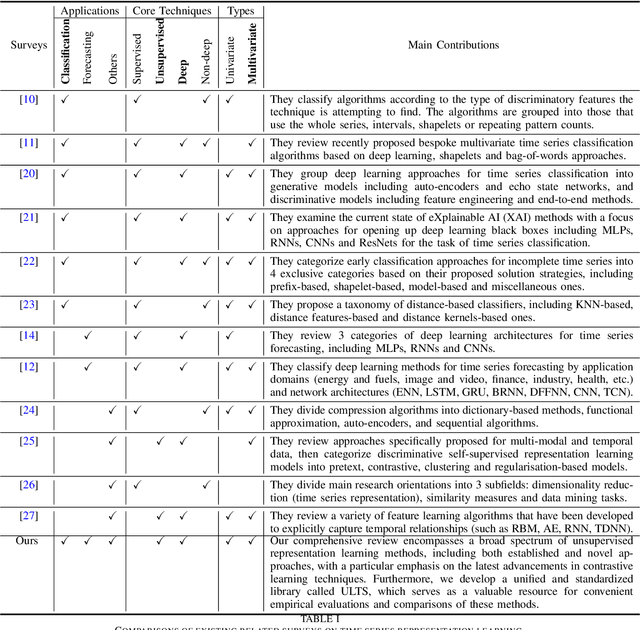
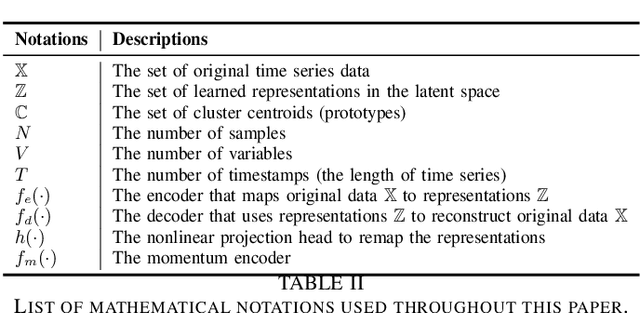
Unsupervised representation learning approaches aim to learn discriminative feature representations from unlabeled data, without the requirement of annotating every sample. Enabling unsupervised representation learning is extremely crucial for time series data, due to its unique annotation bottleneck caused by its complex characteristics and lack of visual cues compared with other data modalities. In recent years, unsupervised representation learning techniques have advanced rapidly in various domains. However, there is a lack of systematic analysis of unsupervised representation learning approaches for time series. To fill the gap, we conduct a comprehensive literature review of existing rapidly evolving unsupervised representation learning approaches for time series. Moreover, we also develop a unified and standardized library, named ULTS (i.e., Unsupervised Learning for Time Series), to facilitate fast implementations and unified evaluations on various models. With ULTS, we empirically evaluate state-of-the-art approaches, especially the rapidly evolving contrastive learning methods, on 9 diverse real-world datasets. We further discuss practical considerations as well as open research challenges on unsupervised representation learning for time series to facilitate future research in this field.
A New Deep State-Space Analysis Framework for Patient Latent State Estimation and Classification from EHR Time Series Data
Jul 21, 2023Many diseases, including cancer and chronic conditions, require extended treatment periods and long-term strategies. Machine learning and AI research focusing on electronic health records (EHRs) have emerged to address this need. Effective treatment strategies involve more than capturing sequential changes in patient test values. It requires an explainable and clinically interpretable model by capturing the patient's internal state over time. In this study, we propose the "deep state-space analysis framework," using time-series unsupervised learning of EHRs with a deep state-space model. This framework enables learning, visualizing, and clustering of temporal changes in patient latent states related to disease progression. We evaluated our framework using time-series laboratory data from 12,695 cancer patients. By estimating latent states, we successfully discover latent states related to prognosis. By visualization and cluster analysis, the temporal transition of patient status and test items during state transitions characteristic of each anticancer drug were identified. Our framework surpasses existing methods in capturing interpretable latent space. It can be expected to enhance our comprehension of disease progression from EHRs, aiding treatment adjustments and prognostic determinations.
Multilevel Wavelet Decomposition Network for Interpretable Time Series Analysis
Jun 23, 2018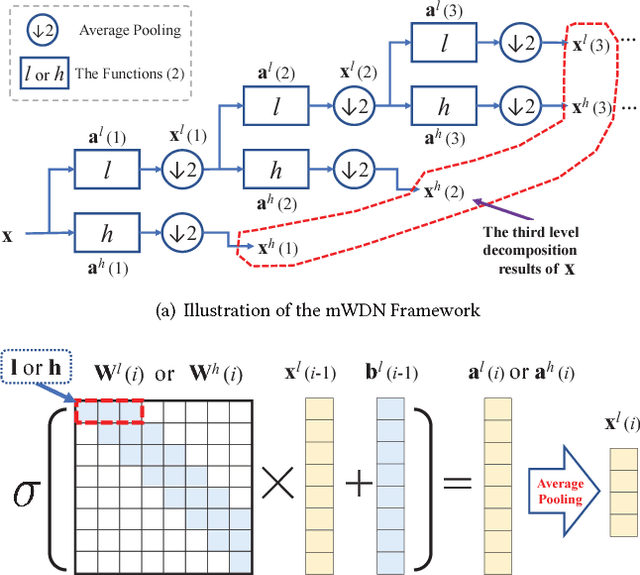
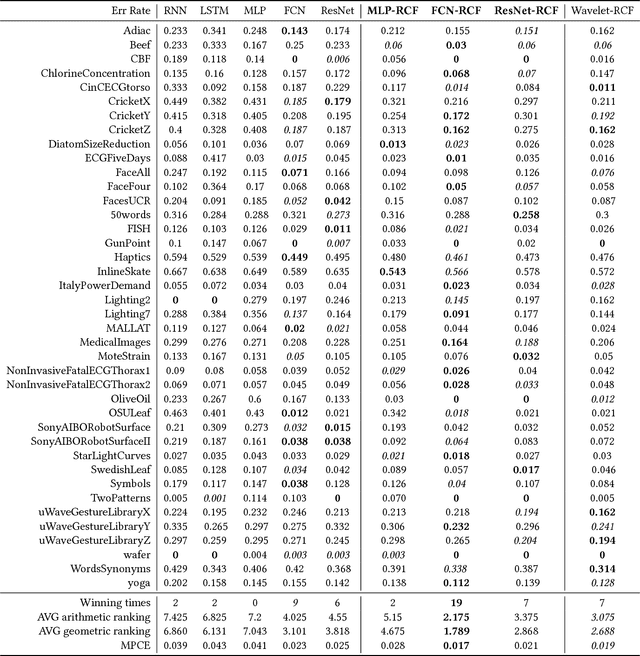
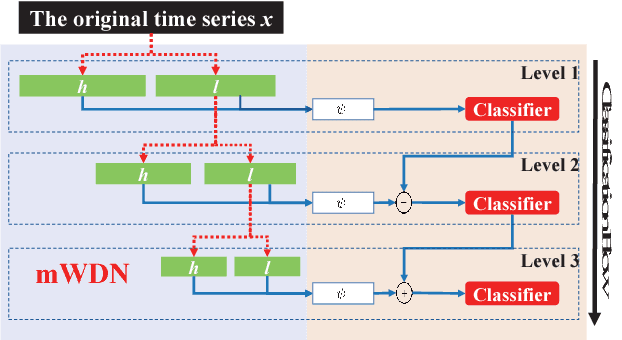
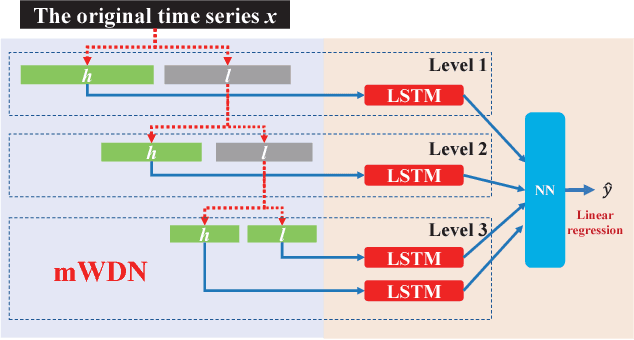
Recent years have witnessed the unprecedented rising of time series from almost all kindes of academic and industrial fields. Various types of deep neural network models have been introduced to time series analysis, but the important frequency information is yet lack of effective modeling. In light of this, in this paper we propose a wavelet-based neural network structure called multilevel Wavelet Decomposition Network (mWDN) for building frequency-aware deep learning models for time series analysis. mWDN preserves the advantage of multilevel discrete wavelet decomposition in frequency learning while enables the fine-tuning of all parameters under a deep neural network framework. Based on mWDN, we further propose two deep learning models called Residual Classification Flow (RCF) and multi-frequecy Long Short-Term Memory (mLSTM) for time series classification and forecasting, respectively. The two models take all or partial mWDN decomposed sub-series in different frequencies as input, and resort to the back propagation algorithm to learn all the parameters globally, which enables seamless embedding of wavelet-based frequency analysis into deep learning frameworks. Extensive experiments on 40 UCR datasets and a real-world user volume dataset demonstrate the excellent performance of our time series models based on mWDN. In particular, we propose an importance analysis method to mWDN based models, which successfully identifies those time-series elements and mWDN layers that are crucially important to time series analysis. This indeed indicates the interpretability advantage of mWDN, and can be viewed as an indepth exploration to interpretable deep learning.
Style Miner: Find Significant and Stable Explanatory Factors in Time Series with Constrained Reinforcement Learning
Mar 21, 2023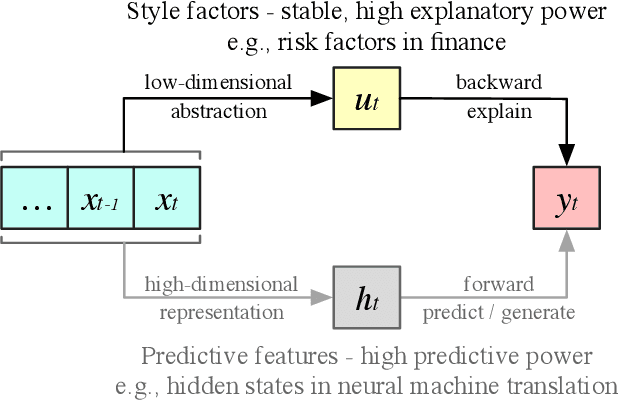
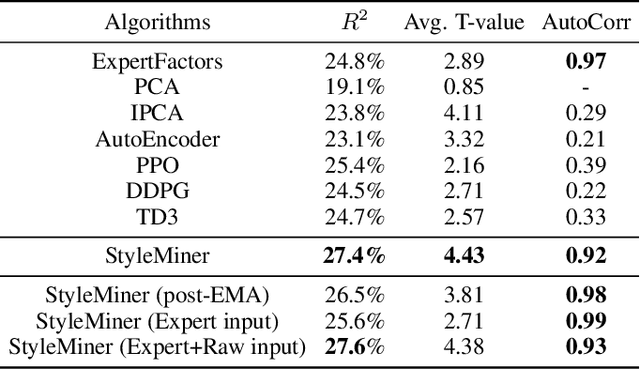
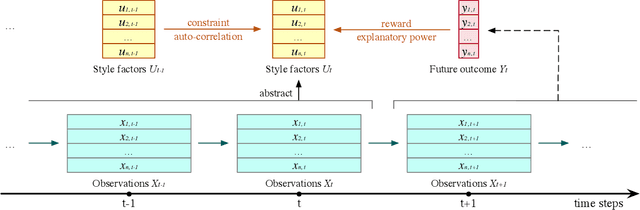
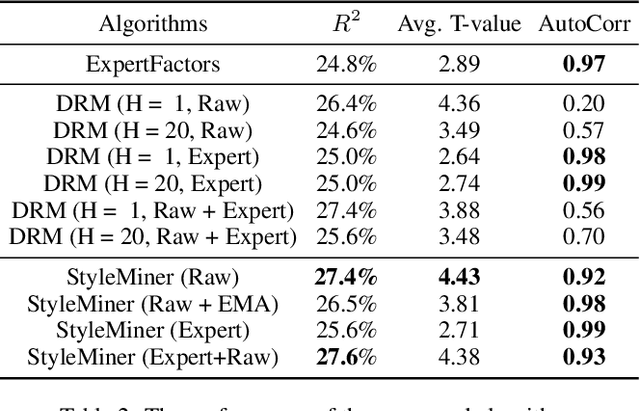
In high-dimensional time-series analysis, it is essential to have a set of key factors (namely, the style factors) that explain the change of the observed variable. For example, volatility modeling in finance relies on a set of risk factors, and climate change studies in climatology rely on a set of causal factors. The ideal low-dimensional style factors should balance significance (with high explanatory power) and stability (consistent, no significant fluctuations). However, previous supervised and unsupervised feature extraction methods can hardly address the tradeoff. In this paper, we propose Style Miner, a reinforcement learning method to generate style factors. We first formulate the problem as a Constrained Markov Decision Process with explanatory power as the return and stability as the constraint. Then, we design fine-grained immediate rewards and costs and use a Lagrangian heuristic to balance them adaptively. Experiments on real-world financial data sets show that Style Miner outperforms existing learning-based methods by a large margin and achieves a relatively 10% gain in R-squared explanatory power compared to the industry-renowned factors proposed by human experts.