 Add to Chrome
 Add to Firefox
 Add to Edge
Analysis of Gene Interaction Graphs for Biasing Machine Learning Models
Paper and Code
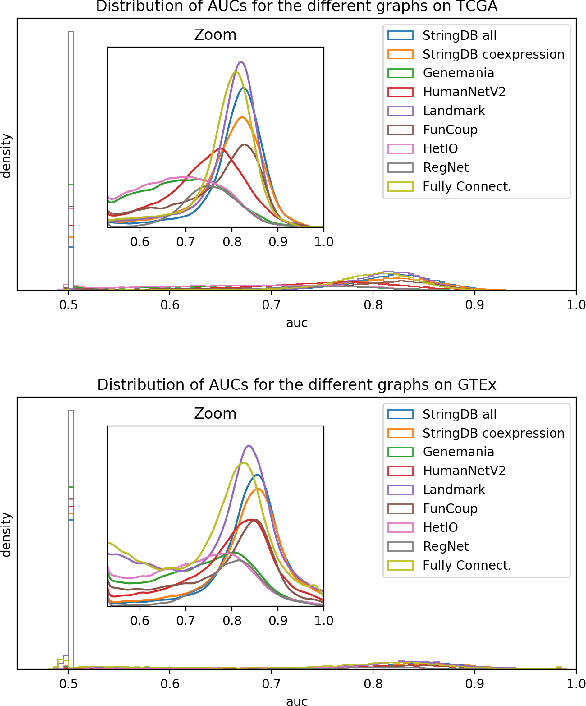
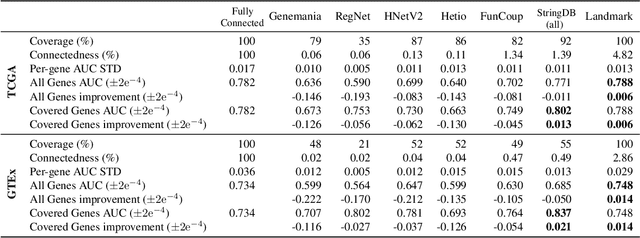
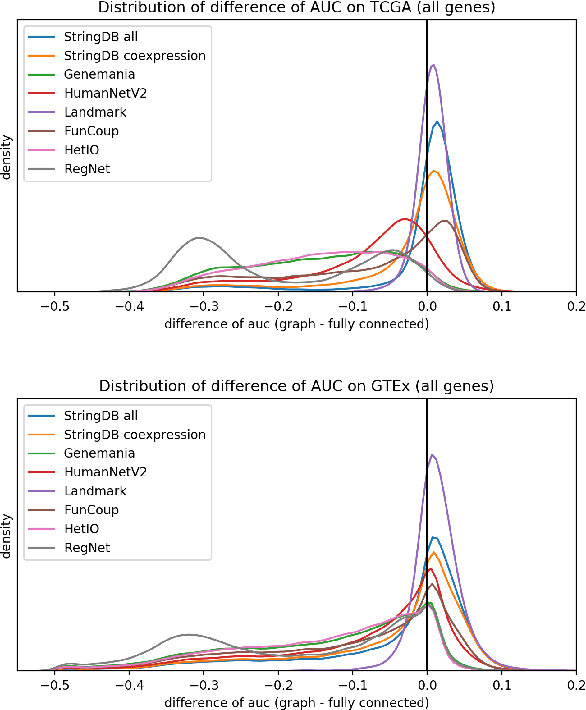
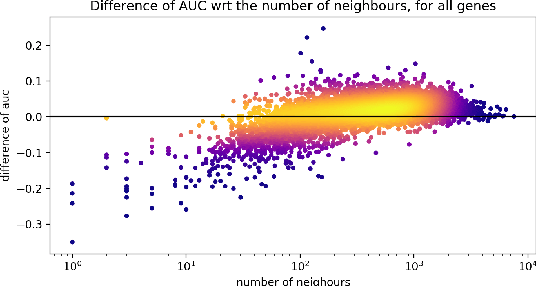
Gene interaction graphs aim to capture various relationships between genes and can be used to create more biologically-intuitive models for machine learning. There are many such graphs available which can differ in the number of genes and edges covered. In this work, we attempt to evaluate the biases provided by those graphs through utilizing them for 'Single Gene Inference' (SGI) which serves as, what we believe is, a proxy for more relevant prediction tasks. The SGI task assesses how well a gene's neighbors in a particular graph can 'explain' the gene itself in comparison to the baseline of using all the genes in the dataset. We evaluate seven major gene interaction graphs created by different research groups on two distinct datasets, TCGA and GTEx. We find that some graphs perform on par with the unbiased baseline for most genes with a significantly smaller feature set.