 Add to Chrome
 Add to Firefox
 Add to Edge
Masoud Safarishaal
Single Pole-To-Earth Fault Detection and Location on the Tehran Railway System Using ICA and PSO Trained Neural Network
Jul 08, 2021
In a railroad feeding system, detecting a location of pole to earth faults is important for safe operation of the system. The goal of this paper is to use a combination of the evolutionary algorithm and neural networks to increase the accuracy of single pole-to-earth fault detection and location on Tehran railroad power supply system. Accordingly, Imperialist Competitive Algorithm (ICA) and Particle Swarm Optimization (PSO) are used to train the neural network for enhancing learning process accuracy and the convergence. Owing to the nonlinearity of system, the fault detection is an ideal application for the proposed method where 600 Hz harmonic ripple method is used in this paper for fault detection. The substations were simulated by considering various situations in feeding the circuit, the transformer and the silicon rectifier has been developed by typical Tehran metro parameters. Required data for the network learning the process have been gathered from simulation results. 600Hz components value will change with the change of the location of single pole to earth fault. Therefore, 600Hz components are used as inputs of the neural network when fault location is the output of the network system. The simulation results show that the fault location can be accurately predicted in proposed methods.
Analysis and Comparison of Time Series of Power Consumption of Sistan and Tehran distribution networks
Jul 07, 2021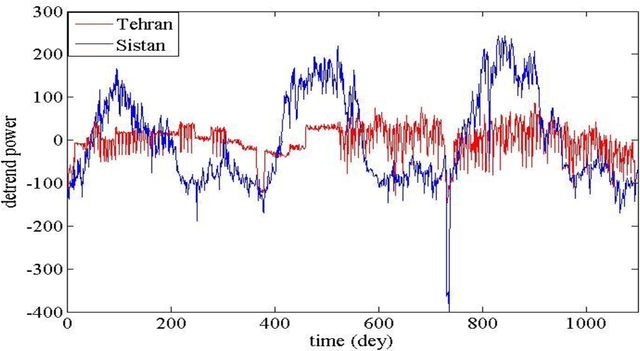
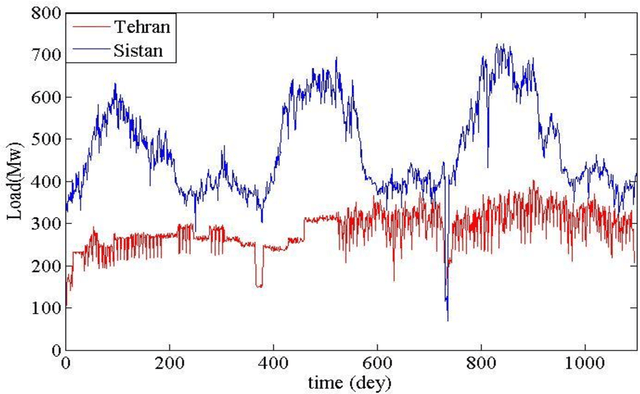
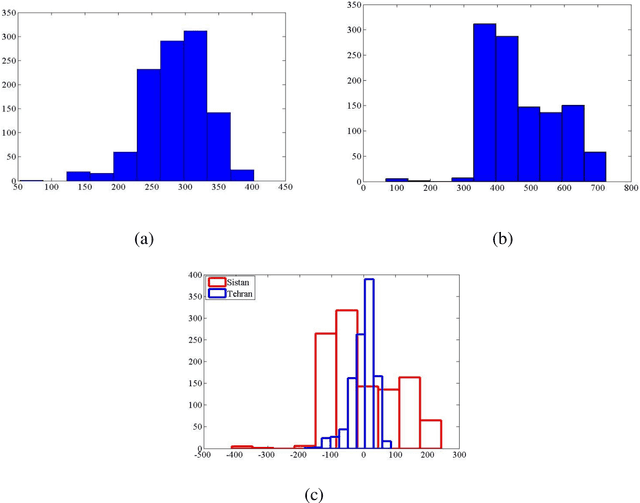
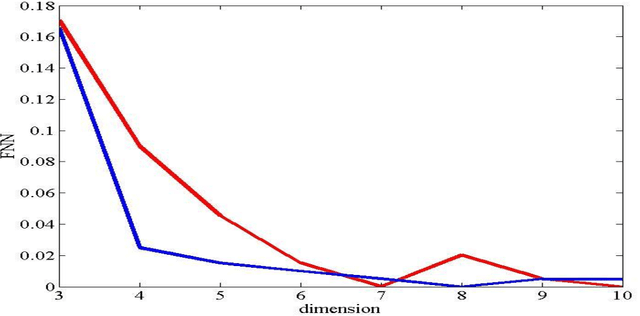
Data presented in the form of time series as its analysis and applications recently have become increasingly important in different areas and domains. Prediction and classification of time-series data play a vital role in multiple fields. In this paper, the time series analysis related to power consumption at 12 o'clock every day in the period of 2012 to 2014 has been compared for two distribution networks of Sistan and one of the four networks of Tehran. By analyzing the power consumption of these two networks, a comparison can be made between these two regions in terms of development and climate difference and the impact of social, industrial and environmental phenomena. The reason for choosing these two networks was to compare a deprived area with an area in the capital. CRP tool software and toolkits have been used to analyze and compare time series, and various tools have been used to compare two time series.