 Add to Chrome
 Add to Firefox
 Add to Edge
Causal Effect Estimation with Global Probabilistic Forecasting: A Case Study of the Impact of Covid-19 Lockdowns on Energy Demand
Sep 19, 2022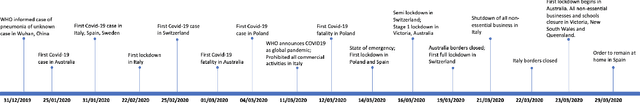
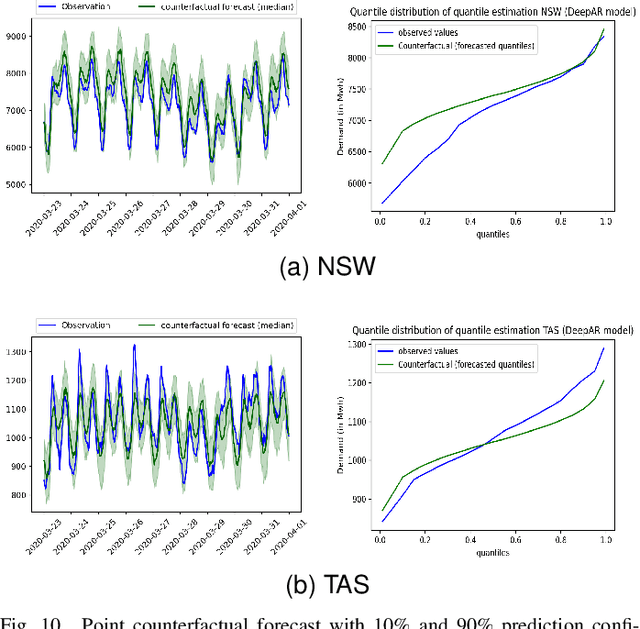
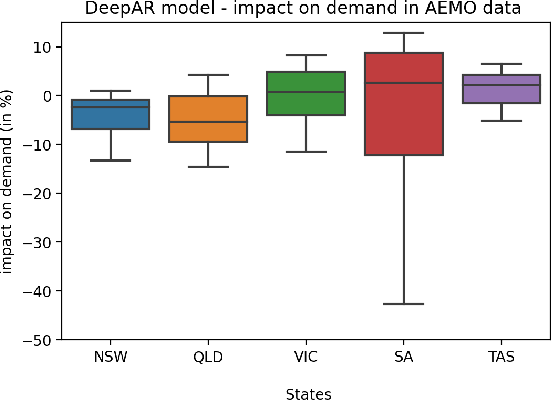
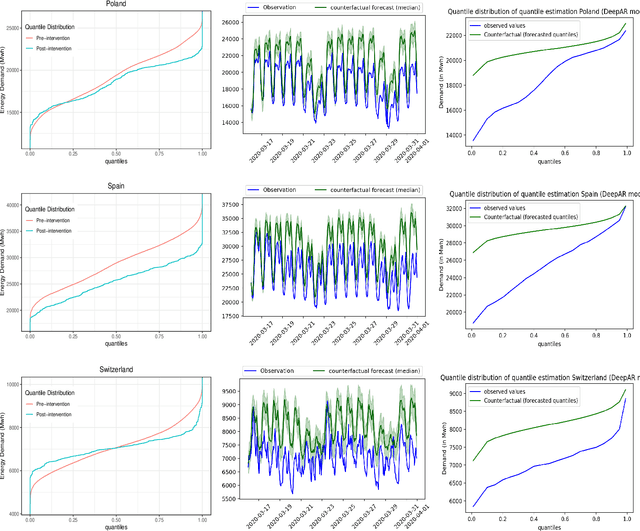
The electricity industry is heavily implementing smart grid technologies to improve reliability, availability, security, and efficiency. This implementation needs technological advancements, the development of standards and regulations, as well as testing and planning. Smart grid load forecasting and management are critical for reducing demand volatility and improving the market mechanism that connects generators, distributors, and retailers. During policy implementations or external interventions, it is necessary to analyse the uncertainty of their impact on the electricity demand to enable a more accurate response of the system to fluctuating demand. This paper analyses the uncertainties of external intervention impacts on electricity demand. It implements a framework that combines probabilistic and global forecasting models using a deep learning approach to estimate the causal impact distribution of an intervention. The causal effect is assessed by predicting the counterfactual distribution outcome for the affected instances and then contrasting it to the real outcomes. We consider the impact of Covid-19 lockdowns on energy usage as a case study to evaluate the non-uniform effect of this intervention on the electricity demand distribution. We could show that during the initial lockdowns in Australia and some European countries, there was often a more significant decrease in the troughs than in the peaks, while the mean remained almost unaffected.
FRANS: Automatic Feature Extraction for Time Series Forecasting
Sep 15, 2022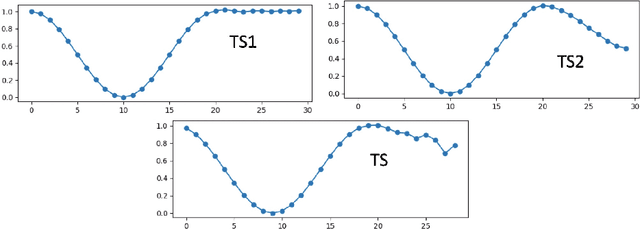
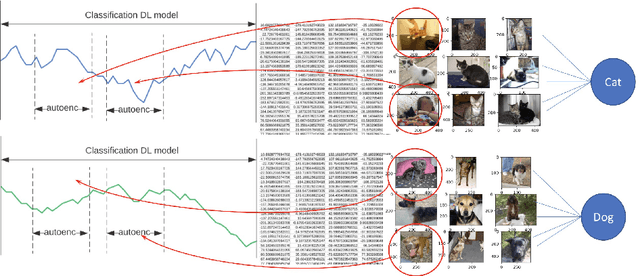
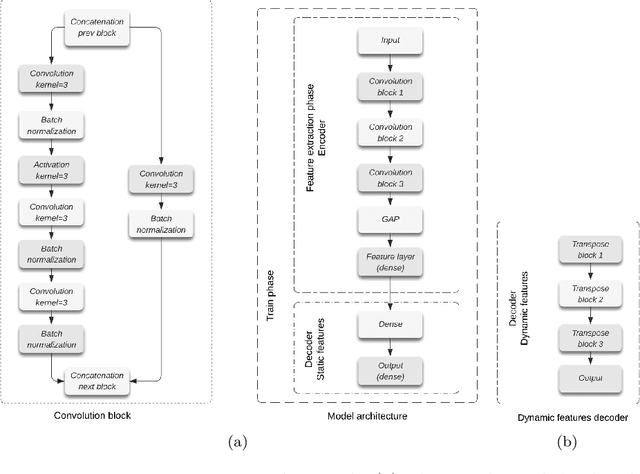
Feature extraction methods help in dimensionality reduction and capture relevant information. In time series forecasting (TSF), features can be used as auxiliary information to achieve better accuracy. Traditionally, features used in TSF are handcrafted, which requires domain knowledge and significant data-engineering work. In this research, we first introduce a notion of static and dynamic features, which then enables us to develop our autonomous Feature Retrieving Autoregressive Network for Static features (FRANS) that does not require domain knowledge. The method is based on a CNN classifier that is trained to create for each series a collective and unique class representation either from parts of the series or, if class labels are available, from a set of series of the same class. It allows to discriminate series with similar behaviour but from different classes and makes the features extracted from the classifier to be maximally discriminatory. We explore the interpretability of our features, and evaluate the prediction capabilities of the method within the forecasting meta-learning environment FFORMA. Our results show that our features lead to improvement in accuracy in most situations. Once trained our approach creates features orders of magnitude faster than statistical methods.
Forecast Evaluation for Data Scientists: Common Pitfalls and Best Practices
Apr 04, 2022
Machine Learning (ML) and Deep Learning (DL) methods are increasingly replacing traditional methods in many domains involved with important decision making activities. DL techniques tailor-made for specific tasks such as image recognition, signal processing, or speech analysis are being introduced at a fast pace with many improvements. However, for the domain of forecasting, the current state in the ML community is perhaps where other domains such as Natural Language Processing and Computer Vision were at several years ago. The field of forecasting has mainly been fostered by statisticians/econometricians; consequently the related concepts are not the mainstream knowledge among general ML practitioners. The different non-stationarities associated with time series challenge the data-driven ML models. Nevertheless, recent trends in the domain have shown that with the availability of massive amounts of time series, ML techniques are quite competent in forecasting, when related pitfalls are properly handled. Therefore, in this work we provide a tutorial-like compilation of the details of one of the most important steps in the overall forecasting process, namely the evaluation. This way, we intend to impart the information of forecast evaluation to fit the context of ML, as means of bridging the knowledge gap between traditional methods of forecasting and state-of-the-art ML techniques. We elaborate on the different problematic characteristics of time series such as non-normalities and non-stationarities and how they are associated with common pitfalls in forecast evaluation. Best practices in forecast evaluation are outlined with respect to the different steps such as data partitioning, error calculation, statistical testing, and others. Further guidelines are also provided along selecting valid and suitable error measures depending on the specific characteristics of the dataset at hand.
LIMREF: Local Interpretable Model Agnostic Rule-based Explanations for Forecasting, with an Application to Electricity Smart Meter Data
Feb 15, 2022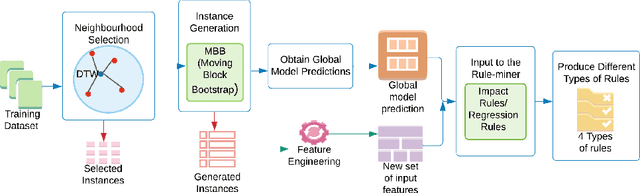
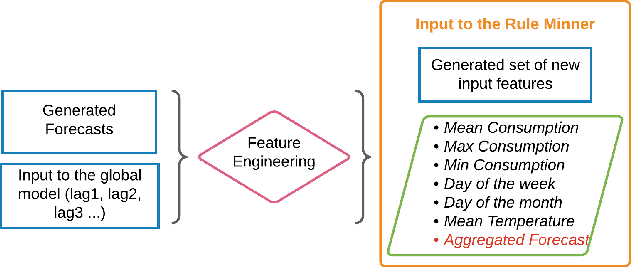
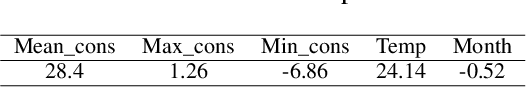
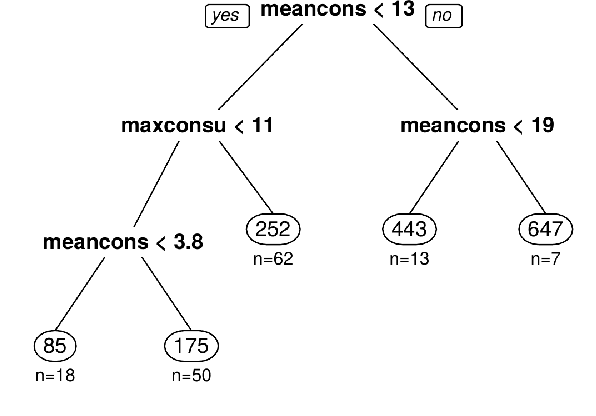
Accurate electricity demand forecasts play a crucial role in sustainable power systems. To enable better decision-making especially for demand flexibility of the end-user, it is necessary to provide not only accurate but also understandable and actionable forecasts. To provide accurate forecasts Global Forecasting Models (GFM) trained across time series have shown superior results in many demand forecasting competitions and real-world applications recently, compared with univariate forecasting approaches. We aim to fill the gap between the accuracy and the interpretability in global forecasting approaches. In order to explain the global model forecasts, we propose Local Interpretable Model-agnostic Rule-based Explanations for Forecasting (LIMREF), a local explainer framework that produces k-optimal impact rules for a particular forecast, considering the global forecasting model as a black-box model, in a model-agnostic way. It provides different types of rules that explain the forecast of the global model and the counterfactual rules, which provide actionable insights for potential changes to obtain different outputs for given instances. We conduct experiments using a large-scale electricity demand dataset with exogenous features such as temperature and calendar effects. Here, we evaluate the quality of the explanations produced by the LIMREF framework in terms of both qualitative and quantitative aspects such as accuracy, fidelity, and comprehensibility and benchmark those against other local explainers.
NeuralProphet: Explainable Forecasting at Scale
Nov 29, 2021
We introduce NeuralProphet, a successor to Facebook Prophet, which set an industry standard for explainable, scalable, and user-friendly forecasting frameworks. With the proliferation of time series data, explainable forecasting remains a challenging task for business and operational decision making. Hybrid solutions are needed to bridge the gap between interpretable classical methods and scalable deep learning models. We view Prophet as a precursor to such a solution. However, Prophet lacks local context, which is essential for forecasting the near-term future and is challenging to extend due to its Stan backend. NeuralProphet is a hybrid forecasting framework based on PyTorch and trained with standard deep learning methods, making it easy for developers to extend the framework. Local context is introduced with auto-regression and covariate modules, which can be configured as classical linear regression or as Neural Networks. Otherwise, NeuralProphet retains the design philosophy of Prophet and provides the same basic model components. Our results demonstrate that NeuralProphet produces interpretable forecast components of equivalent or superior quality to Prophet on a set of generated time series. NeuralProphet outperforms Prophet on a diverse collection of real-world datasets. For short to medium-term forecasts, NeuralProphet improves forecast accuracy by 55 to 92 percent.
LoMEF: A Framework to Produce Local Explanations for Global Model Time Series Forecasts
Nov 13, 2021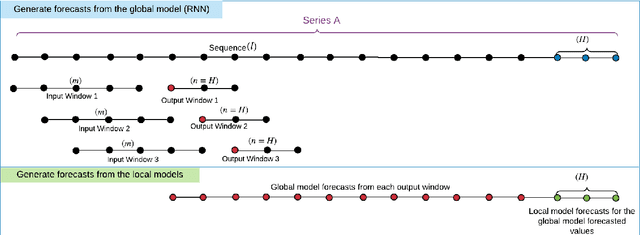
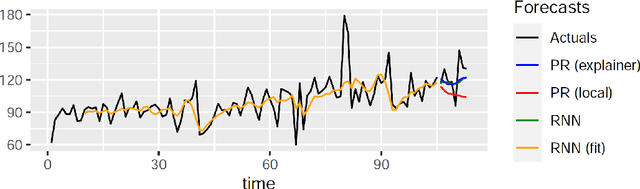
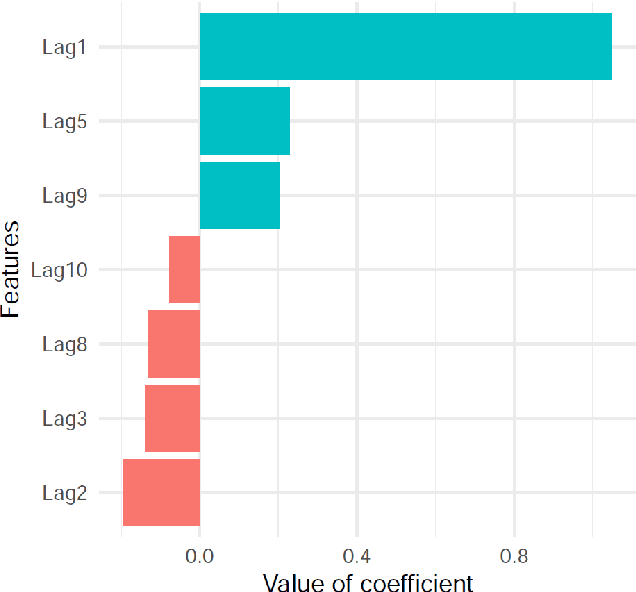
Global Forecasting Models (GFM) that are trained across a set of multiple time series have shown superior results in many forecasting competitions and real-world applications compared with univariate forecasting approaches. One aspect of the popularity of statistical forecasting models such as ETS and ARIMA is their relative simplicity and interpretability (in terms of relevant lags, trend, seasonality, and others), while GFMs typically lack interpretability, especially towards particular time series. This reduces the trust and confidence of the stakeholders when making decisions based on the forecasts without being able to understand the predictions. To mitigate this problem, in this work, we propose a novel local model-agnostic interpretability approach to explain the forecasts from GFMs. We train simpler univariate surrogate models that are considered interpretable (e.g., ETS) on the predictions of the GFM on samples within a neighbourhood that we obtain through bootstrapping or straightforwardly as the one-step-ahead global black-box model forecasts of the time series which needs to be explained. After, we evaluate the explanations for the forecasts of the global models in both qualitative and quantitative aspects such as accuracy, fidelity, stability and comprehensibility, and are able to show the benefits of our approach.
Pruning vs XNOR-Net: A Comprehensive Study of Deep Learning for Audio Classification on Edge-devices
Aug 29, 2021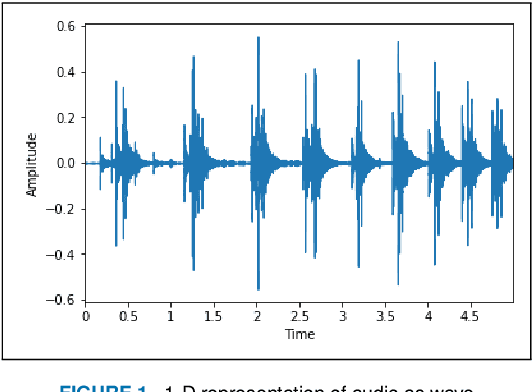
Deep Learning has celebrated resounding successes in many application areas of relevance to the Internet-of-Things, for example, computer vision and machine listening. To fully harness the power of deep leaning for the IoT, these technologies must ultimately be brought directly to the edge. The obvious challenge is that deep learning techniques can only be implemented on strictly resource-constrained edge devices if the models are radically downsized. This task relies on different model compression techniques, such as network pruning, quantization, and the recent advancement of XNOR-Net. This paper examines the suitability of these techniques for audio classification on microcontrollers. We present an XNOR-Net for end-to-end raw audio classification and a comprehensive empirical study comparing this approach with pruning-and-quantization methods. We show that raw audio classification with XNOR yields comparable performance to regular full precision networks for small numbers of classes while reducing memory requirements 32-fold and computation requirements 58-fold. However, as the number of classes increases significantly, performance degrades, and pruning-and-quantization based compression techniques take over as the preferred technique being able to satisfy the same space constraints but requiring about 8x more computation. We show that these insights are consistent between raw audio classification and image classification using standard benchmark sets. To the best of our knowledge, this is the first study applying XNOR to end-to-end audio classification and evaluating it in the context of alternative techniques. All code is publicly available on GitHub.
A Look at the Evaluation Setup of the M5 Forecasting Competition
Aug 08, 2021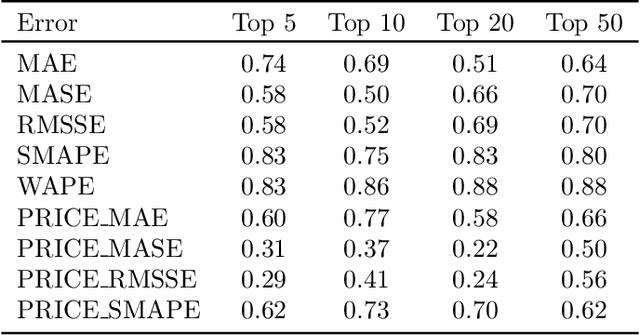
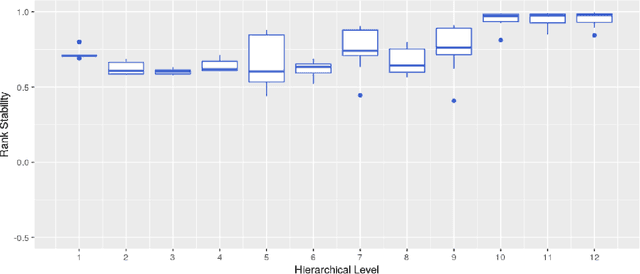
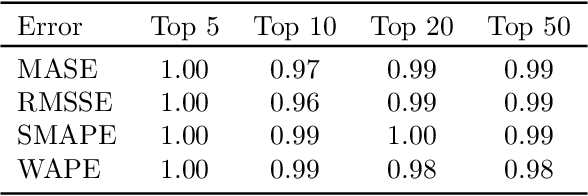
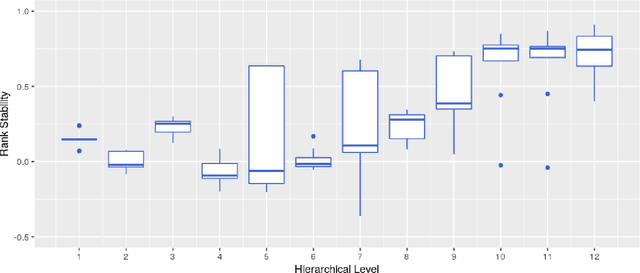
Forecast evaluation plays a key role in how empirical evidence shapes the development of the discipline. Domain experts are interested in error measures relevant for their decision making needs. Such measures may produce unreliable results. Although reliability properties of several metrics have already been discussed, it has hardly been quantified in an objective way. We propose a measure named Rank Stability, which evaluates how much the rankings of an experiment differ in between similar datasets, when the models and errors are constant. We use this to study the evaluation setup of the M5. We find that the evaluation setup of the M5 is less reliable than other measures. The main drivers of instability are hierarchical aggregation and scaling. Price-weighting reduces the stability of all tested error measures. Scale normalization of the M5 error measure results in less stability than other scale-free errors. Hierarchical levels taken separately are less stable with more aggregation, and their combination is even less stable than individual levels. We also show positive tradeoffs of retaining aggregation importance without affecting stability. Aggregation and stability can be linked to the influence of much debated magic numbers. Many of our findings can be applied to general hierarchical forecast benchmarking.
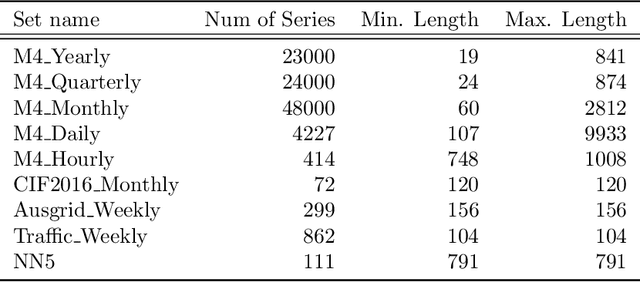
Monash Time Series Forecasting Archive
May 14, 2021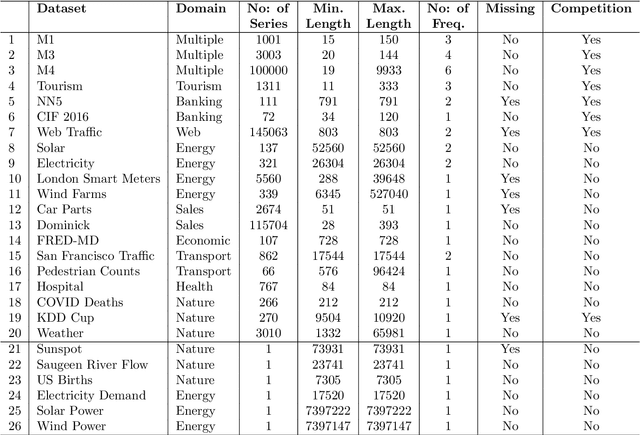
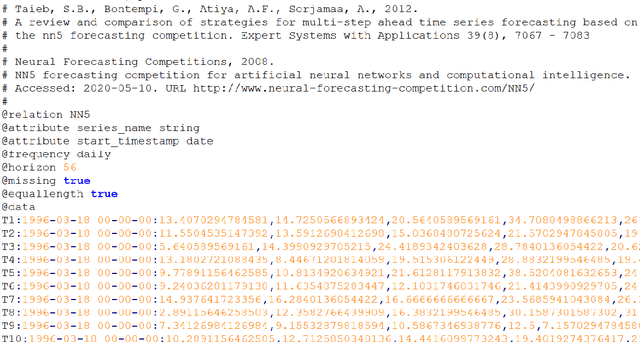
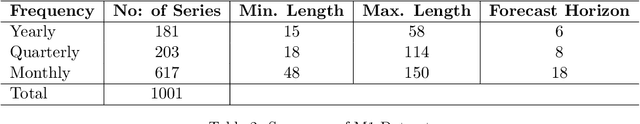
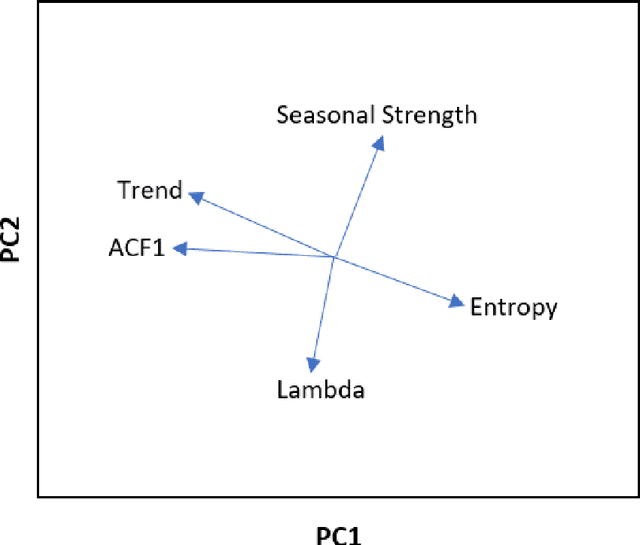
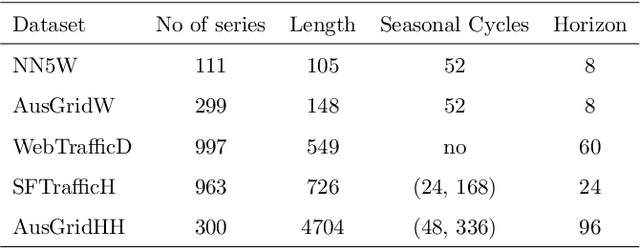
Many businesses and industries nowadays rely on large quantities of time series data making time series forecasting an important research area. Global forecasting models that are trained across sets of time series have shown a huge potential in providing accurate forecasts compared with the traditional univariate forecasting models that work on isolated series. However, there are currently no comprehensive time series archives for forecasting that contain datasets of time series from similar sources available for the research community to evaluate the performance of new global forecasting algorithms over a wide variety of datasets. In this paper, we present such a comprehensive time series forecasting archive containing 20 publicly available time series datasets from varied domains, with different characteristics in terms of frequency, series lengths, and inclusion of missing values. We also characterise the datasets, and identify similarities and differences among them, by conducting a feature analysis. Furthermore, we present the performance of a set of standard baseline forecasting methods over all datasets across eight error metrics, for the benefit of researchers using the archive to benchmark their forecasting algorithms.
Environmental Sound Classification on the Edge: A Pipeline for Deep Acoustic Networks on Extremely Resource-Constrained Devices
Apr 06, 2021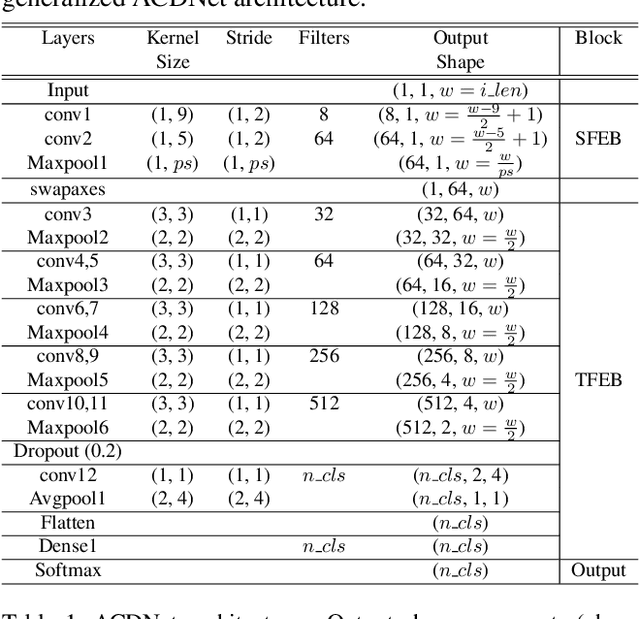
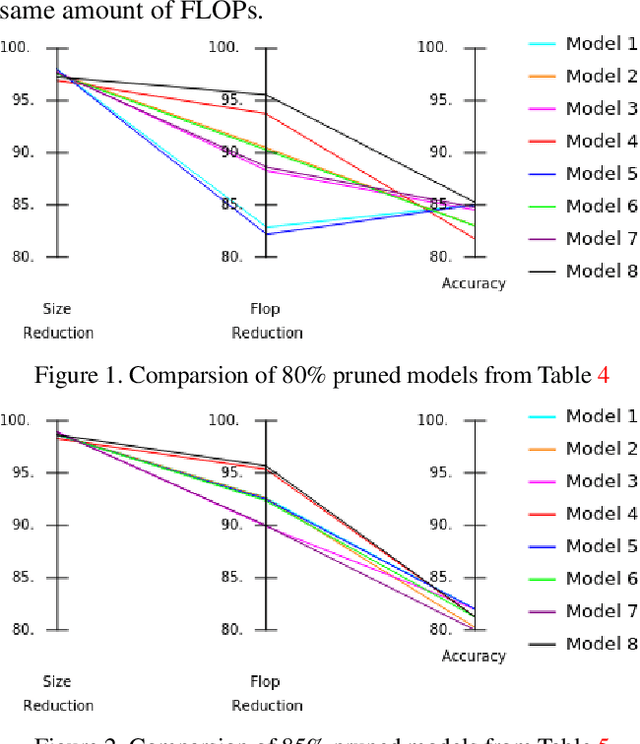
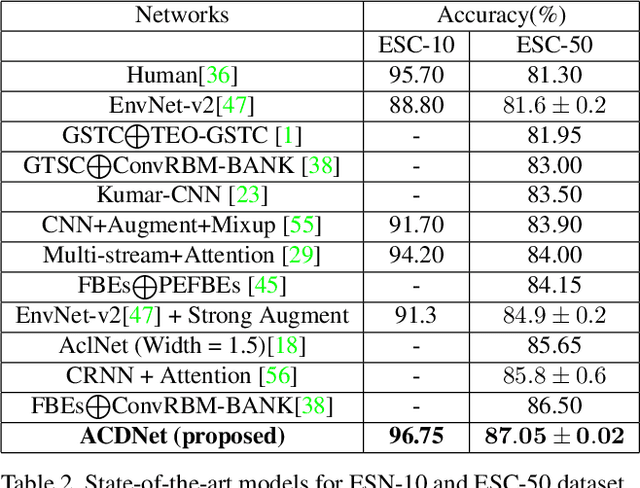
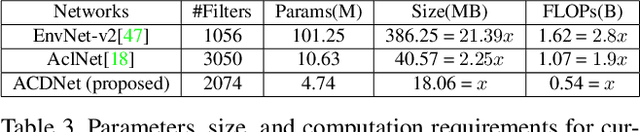
Significant efforts are being invested to bring state-of-the-art classification and recognition to edge devices with extreme resource constraints (memory, speed and lack of GPU support). Here, we demonstrate the first deep network for acoustic recognition that is small enough for an off-the-shelf microcrocontroller, yet achieves state-of-the-art performance on standard benchmarks. Rather than handcrafting a once-off solution, we present a universal pipeline that converts a large deep convolutional network automatically via compression and quantization into a network for resource-impoverished edge devices. After introducing ACDNet, which produces above state-of-the-art accuracy on ESC-10 (96.65%) and ESC-50 (87.1%), we describe the compression pipeline and show that it allows us to achieve 97.22% size reduction and 97.28% FLOP reduction while maintaining close to state-of-the-art accuracy (83.65% on ESC-50). We describe a successful implementation on a standard off-the-shelf microcontroller and, beyond laboratory benchmarks, report successful tests on real-world data sets.